MATHS & REASONING BY - DR V K OMAR

Question: 1
In July, if 40% of the Gross revenue of the magazine was collected from advertisement, what was the amount of Gross revenue collected from advertisement in that particular month?
जुलाई में, यदि पत्रिका के सकल राजस्व का 40% विज्ञापन से एकत्र किया गया था, तो उस विशेष महीने में विज्ञापन से एकत्रित सकल राजस्व की राशि क्या थी?
(A) Rs. 144000
(B) Rs. 148000
(C) Rs. 172000
(D) Rs. 182000
Ans: C
Gross revenue of July collected from advertisement
= 362000 + 28000 + 40000
= 390000 + 40000 = 430000
Gross revenue collected from advertisement
=
= 4300 × 40 = Rs. 172000.
Question: 2
What is the difference between Net revenue of the magazine in April and its Gross revenue in June?
अप्रैल में पत्रिका के शुद्ध राजस्व और जून में उसके सकल राजस्व के बीच क्या अंतर है?
(A) Rs. 118000
(B) Rs. 124000
(C) Rs. 126000
(D) Rs. 136000
Ans: C
Net revenue in April = 320000 – 44000 = Rs. 276000
Gross revenue in June = 330000 + 72000 = Rs. 402000.
Required difference = 402000 – 276000 = Rs. 126000.
Question: 3
In May, the respective ratio of amount allocated for commission and amount allocated for discount and others was 4 : 3. What was the Gross revenue of the magazine in May?
मई में, कमीशन के लिए आवंटित राशि और छूट और अन्य के लिए आवंटित राशि का संबंधित अनुपात 4:3 था। मई में पत्रिका का सकल राजस्व क्या था?
(A) Rs. 380000
(B) Rs. 420000
(C) Rs. 430000
(D) Rs. 435000
Ans: B
In May, ratio of amount allocated for commission and
Amount allocated for discount = 4 : 3.
In May, amount allocated for commission = 4 × 12000 and 3 × 12000.
Amount allocated for discount = 48000 and 36000
∴ Gross revenue in May net revenue + amount allocated for commission = 336000 + 84000 = Rs. 420000.
Question: 4
Amount allocated for commission in March is what percent less than the amount allocated for commission in July?
मार्च में कमीशन के लिए आवंटित राशि जुलाई में कमीशन के लिए आवंटित राशि से कितना प्रतिशत कम है?
(A) 22%
(B) 24%
(C) 26%
(D) 28%
Ans: A
Amount collected for commission in March = 31200
Amount collected for commission in July = 40000.
Required percentage =
Question: 5
In March, if Net revenue of the magazine was 85% of its Gross revenue, what was the amount allocated for discount and others?
मार्च में, यदि पत्रिका का शुद्ध राजस्व उसके सकल राजस्व का 85% था, तो छूट और अन्य के लिए आवंटित राशि क्या थी?
(A) Rs. 22400
(B) Rs. 22800
(C) Rs. 23200
(D) Rs. 24200
Ans: B
In March,
Net revenue =
∴ Amount allocated for discount and others
= 360000 – 306000 – 31200 = 54000 – 31200 = 22800.
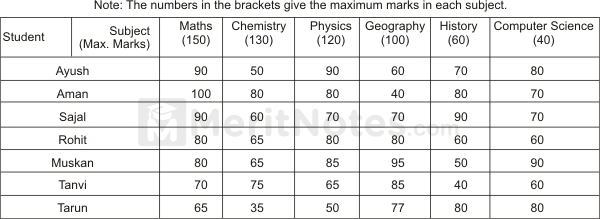
The following table gives the percentage of marks obtained by 7 students in 6 different subjects in an examination. Study the table and answer the questions based on it.
Question: 1
What was the aggregate of marks obtained by Sajal in all the six subjects?
सजल द्वारा सभी छह विषयों में प्राप्त अंकों का योग कितना था?
(A) 429
(B) 439
(C) 449
(D) 459
Ans: C
Aggregate marks obtained by Sajal
= (90% of 150) + (60% of 130) + (70% of 120) + (70% of 100) + (90% of 60) + (70% of 40)
= (135 + 78 + 84 + 70 + 54 + 28) = 449.
Question: 2
The number of students who obtained 60% and above marks in all the subjects is
सभी विषयों में 60% और उससे अधिक अंक प्राप्त करने वाले छात्रों की संख्या है
(A) 1
(B) 2
(C) 3
(D) 4
Ans: B
From the given table it is clear that Sajal and Rohit obtained 60% or more marks in each of the 6 subjects.
Question: 3
What is the overall percentage of Tarun?
तरुण का कुल प्रतिशत कितना है?
(A) 55%
(B) 60%
(C) 63%
(D) 64.5%
Ans: B
Aggregate marks obtained from Tarun
= (65% of 150) + (35% of 130) + (50% of 120) + (77% of 100) + (80% of 60) + (80% of 40)
= (97.5 + 44.5 + 60 + 77 + 48 + 32) = 360.
Total maximum marks of all the 6 subjects
= (150 + 130 + 120 + 100 + 60 + 40) = 600.
Overall percentage of Tarun =
Question: 4
What are the average marks obtained by all the seven students in Physics? (rounded off to two digits after decimal)
भौतिकी में सभी सात छात्रों द्वारा प्राप्त औसत अंक क्या हैं? (दशमलव के बाद दो अंकों तक पूर्णांकित)
(A) 77.26
(B) 79.14
(C) 89.14
(D) 91.37
Ans: C
Total marks obtained in Physics by all the 7 students
= (90% of 120) + (80% of 120) + (70% of 120) + (80% of 120) + (85% of 120) + (65% of 120) + (50% of 120)
= (108 + 96 + 84 + 96 + 102 + 78 + 60) = 624.
∴ Average marks obtained by them in Physics =
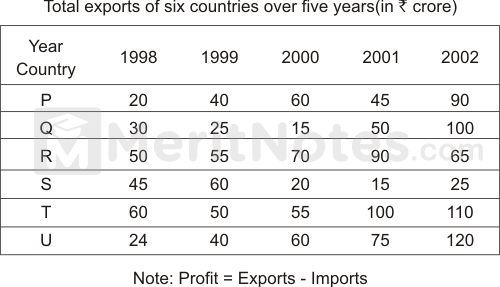
Study the table carefully and answer the questions.
Question: 1
What was the profit of all the countries together in the year 2002 if the total imports of all the countries together was Rs. 385 crore?
वर्ष 2002 में सभी देशों का एक साथ लाभ कितना था यदि सभी देशों का कुल आयात एक साथ रु। 385 करोड़?
(A) Rs. 85 crore
(B) Rs. 125 crore
(C) Rs. 160 crore
(D) Rs. 280 crore
Ans: B
Total import of all countries together in 2002 = Rs. 385 crore.
Now, in 2002 total export of all companies together
= 90 + 100 + 65 + 25 + 110 + 120 = 510 crore.
Total profit in 2002 = 510 – 385 = 125 crore.
Question: 2
If the ratio of export to import in country S and Country U is 1 : 2 and 4 : 1 in the year 1998, then what is the total import of country U and S together in that particular years?
यदि वर्ष 1998 में देश S और देश U में निर्यात का आयात से अनुपात 1:2 और 4:1 है, तो उस विशेष वर्ष में देश U और S का कुल आयात कितना है?
(A) 52
(B) 62
(C) 82
(D) 96
Ans: D
Import of company S in the year 1998
=
Import of company U in the year 1998
=
Total import of company U and S together in 1998
= Rs. (90 + 6) = 96 crore.
Question: 3
If the export of country P in the year 2003 is 20% more than the total export of country Q in 2001 and the export of Country T in 2000 together, then what was the profit of P in the year 2003 if its import was Rs. 92 crore for that year?
यदि वर्ष 2003 में देश P का निर्यात 2001 में देश Q के कुल निर्यात और 2000 में देश T के निर्यात से 20% अधिक है, तो वर्ष 2003 में P का लाभ कितना था यदि इसका आयात रु। उस वर्ष के लिए 92 करोड़?
(A) 10
(B) 22
(C) 34
(D) 46
Ans: C
Total export of country Q in 2001 = Rs. 50 crore.
Total export of country T in 2000 = Rs. 55 crore.
Total export = 50 + 55 = 105 crore.
Now, total export of country P in 2003 =
Total import of country P in 2003
= Rs. 92 crore. Profit = 126 – 92 = Rs. 34 crore.
Question: 4
By what percent is the average export of country T over all the given years more than the average export of country R over all the given years?
सभी दिए गए वर्षों में देश T का औसत निर्यात सभी दिए गए वर्षों में देश R के औसत निर्यात से कितने प्रतिशत अधिक है?
(A)
(B)
(C)
(D)
Total export of country T = 60 + 50 + 55 + 110 + 110 = 376
Average export of country T =
Total export of country R = 50 + 55 + 70 + 90 + 65 = 330
Average export of country R =
Required % =
Question: 5
What is the percent increase in the export of all the countries together during the year 1992 to 2001?
सभी वर्ष वर्ष में जितने भी वर्ष हों उतने वर्ष में कितने वर्ष के लिए?
(A) 38.89%
(B) 40.60%
(C) 62.89%
(D) 72.39%
Ans: A
Total export of all countries together in 1999
= 40 + 25 + 55 + 60 + 50 + 40 = Rs. 270 crore.
Total export of all countries together in 2001
= 45 + 50 + 90 + 15 + 100 + 75 = Rs. 375 crore.
Required % increase
=
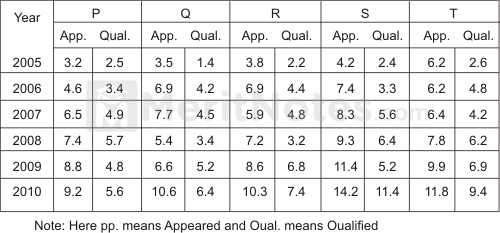
Study the given table carefully and answer the questions that follow. Number of candidates appeared and qualified for a test (in hundreds) in 6 different years from 5 different zones.
Question: 1
Study the given table carefully and answer the questions that follow.
Number of candidates appeared and qualified for a test (in hundreds) in 6 different years from 5 different zones.
In which years was in zones the difference between the appeared candidates and qualified candidates the second lowest?
ज़ोन में किस वर्ष में उपस्थित उम्मीदवारों और योग्य उम्मीदवारों के बीच का अंतर दूसरा सबसे कम था?
(A) 2005
(B) 2006
(C) 2007
(D) 2008
Ans: C
In zone S, the difference between the appeared candidates and the qualified candidates in various year is given below.
2005 → (4.2 – 2.4) = 1.8,
2006 → (7.4 – 3.3) = 4.1,
2007 → (8.3 – 5.6) = 2.7,
2008 → (9.3 – 6.4) = 2.9
2009 → (11.4 – 5.2) = 6.2,
2010 → (14.2 – 11.4) = 2.8
It was lowest in 2005 and second lowest in 2007.
Question: 2
The number of candidates who qualified the test from zone R in the year 2010 was approximately what percentage of the number of candidates who appeared from zone Q in the year 2008?
वर्ष 2010 में जोन R से परीक्षा उत्तीर्ण करने वाले उम्मीदवारों की संख्या वर्ष 2008 में जोन Q से उपस्थित होने वाले उम्मीदवारों की संख्या का लगभग कितना प्रतिशत थी?
(A) 132
(B) 137
(C) 142
(D) 152
Ans: B
Required percentage =
Question: 3
What was the average number of candidates appeared from zone T over all the years together?
2010 में भविष्य में आने वाले भविष्य की गणना भविष्य में भविष्य में होने वाले भविष्य की भविष्यवाणी की जा सकती है?
(A) 805
(B) 810
(C) 820
(D) 830
Ans: A
Average number of candidates appeared from T all over the years =
Question: 4
What was the ratio of the number of candidates appeared from zone P in the year 2005 to the number of candidates qualified from zone S in the year 2007?
वर्ष 2005 में ज़ोन P से उपस्थित होने वाले उम्मीदवारों की संख्या का वर्ष 2007 में ज़ोन S से योग्य उम्मीदवारों की संख्या से अनुपात कितना था?
(A) 4 : 1
(B) 4 : 3
(C) 4 : 7
(D) 9 : 4
Ans: C
Required ratio =
Question: 5
From which zone was the total number of candidates who qualified the test, the second highest in the year?
वर्ष में दूसरे स्थान पर परीक्षा उत्तीर्ण करने वाले उम्मीदवारों की कुल संख्या किस क्षेत्र से थी?
(A) P
(B) Q
(C) S
(D) T
Ans: D
Total number of candidates who qualified the test in 2009 and 2010 from various zones are
P → (4.8 + 5.6) = 10.4,
Q → (5.2 + 6.4) = 116,
R → (6.8 + 7.4) = 14.2.
S → (5.2 + 11.4) = 16.6,
T → (6.9 + 9.4) = 16.3.
It was highest from zone S and second highest from zone T.
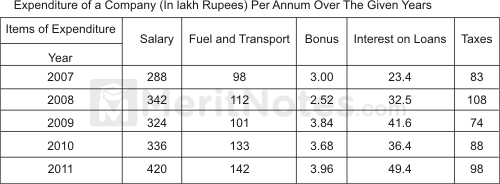
Study the following table and answer the questions that are given below.
Question: 1
Study the following table and answer the questions that are given below.
The ratio between the total expenditure on Taxes for all the years and the total expenditure of Fuel and Transport for all the years respectively, is approximately
सभी वर्षों के लिए करों पर कुल व्यय और सभी वर्षों के लिए ईंधन और परिवहन के कुल व्यय के बीच का अनुपात लगभग है
(A) 2 : 3
(B) 4 : 7
(C) 5 : 6
(D) 10 : 13
Question: 2
The total expenditure of the company over these items during the year 2009 is
वर्ष 2009 के दौरान इन मदों पर कंपनी का कुल व्यय है
(A) Rs. 478.87 lakhs
(B) Rs. 501.11 lakhs
(C) Rs. 544.44 lakhs
(D) Rs. 612.13 lakhs
Ans: C
Total expenditure during 2009 = Rs. (324 + 101 + 3.84 + 41.6 + 74) lakh. = 544.44 lakh.
Question: 3
What is the average amount of interest per year which the company had to pay during this period?
इस अवधि के दौरान कंपनी को प्रति वर्ष ब्याज की औसत राशि कितनी चुकानी पड़ी?
(A) Rs. 34.18 lakhs
(B) Rs. 35.69 lakhs
(C) Rs. 36.66 lakhs
(D) Rs. 38.66 lakhs
Ans: C
Total amount of interest paid during the period
= Rs. (23.4 + 32.5 + 41.6 + 36.4 + 49.4) lakhs = 183.3 lakhs.
Average amount of interest paid per year
= Rs.
Question: 4
The total number of bonus paid by the company during the given period is approximately what percent of the total amount of salary paid during this period?
दी गई अवधि के दौरान कंपनी द्वारा भुगतान किए गए बोनस की कुल संख्या इस अवधि के दौरान भुगतान किए गए वेतन की कुल राशि का लगभग कितना प्रतिशत है?
(A) 0.1%
(B) 0.5%
(C) 0.7%
(D) 1%
Ans: D
Total amount of bonus paid = Rs. (3 + 2.52 + 3.84 + 3.68 + 3.96) lakh = 17 lakh.
Total amount of salary paid = Rs. (288 + 342 + 324 + 336 + 420) lakh. = 170 lakh.
Required % =

Question: 1
What is the approximate percentage decrease in the number of boys in School D in the year 2008 as compared to that in the previous year?
वर्ष 2008 में स्कूल D में लड़कों की संख्या में पिछले वर्ष की तुलना में लगभग कितने प्रतिशत की कमी है?
(A) 5%
(B) 9%
(C) 12%
(D) 17%
Ans: D
Number of boys in School D in 2007 = (6.4 x 100) = 640.
Number of boys in School D in 2008 = (5.3 x 100) = 530.
Decrease % =
Question: 2
The number of girls in School B in the year 2009 is approximately what percent of the total number of students in School E in the year 2006?
वर्ष 2009 में स्कूल B में लड़कियों की संख्या वर्ष 2006 में स्कूल E में छात्रों की कुल संख्या का लगभग कितना प्रतिशत है?
(A) 52%
(B) 58%
(C) 60%
(D) 65%
Ans: D
Number of girls in School B in 2009 = (5.9 x 100) = 590.
Total number of students in School E in 2006 = (5.5 + 3.6) × 100 = (9.1 × 100) = 910.
Required % =
Question: 3
What is the average number of girls in School A in all the years taken together?
सभी वर्षों को मिलाकर स्कूल A में लड़कियों की औसत संख्या कितनी है?
(A) 600
(B) 760
(C) 800
(D) 860
Ans: D
Average number of girls in School A over the years
=
=
Question: 4
What is the ratio of the number of boys in School C in the year 2009 to the number of girls in School A in the year 2009?
वर्ष 2009 में स्कूल C में लड़कों की संख्या का वर्ष 2009 में स्कूल A में लड़कियों की संख्या से अनुपात कितना है?
(A) 29: 41
(B) 29 : 43
(C) 36 : 11
(D) 36 : 13
Ans: B
(Number of boys in C in 2009) : (Number of girls in A in 2009)
= (8.7 x 100) : (12.9 x 100)
=
Question: 5
In which year is the total number of students the third highest in School E?
किस वर्ष स्कूल E में छात्रों की कुल संख्या तीसरे सबसे अधिक है?
(A) 2005
(B) 2006
(C) 2007
(D) 2008
Ans: B
Total number of students in School E in various years:
2005 ⇒ (6.5 + 6.6) × 100 = 1310,
2006 ⇒ (5.5 + 3.6) × 100 = 910,
2007 ⇒ (2.7 + 2.4) × 100 = 510,
2008 ⇒ (5.4 + 5.7) × 100 = 1110,
2009 ⇒ (6.8 + 6.5) × 100 = 1330,
2010 ⇒ (10.8 + 12.7) × 100 = 2350.
It is highest in 2010, 2nd highest in 2009 and third highest in 2005.

Question: 1
What is the respective ratio of the number of females in Production department to the number of females in the Marketing department?
उत्पादन विभाग में महिलाओं की संख्या का विपणन विभाग में महिलाओं की संख्या से संबंधित अनुपात कितना है?
(A) 22 : 23
(B) 23 : 22
(C) 33 : 35
(D) 35 : 33
Ans: B
Number of females in Production : Number of females in Marketing
=
Question: 2
What is the total number of employees in all the departments together?
सभी विभागों में मिलाकर कर्मचारियों की कुल संख्या कितनी है?
(A) 3030
(B) 3140
(C) 3310
(D) 3260
Ans: C
Total number of employees in all the departments
= (840 + 220 + 900 + 360 + 450 + 540) = 3310.
Question: 3
The total number of employees in the HR department forms approximately what percent of the total number of employees in the Accounts department?
मानव संसाधन विभाग में कर्मचारियों की कुल संख्या लेखा विभाग में कर्मचारियों की कुल संख्या का लगभग कितना प्रतिशत है?
(A) 149%
(B) 157%
(C) 164%
(D) 178%
Ans: C
Required percentage =
Question: 4
What is the total number of males in the IT and Customer service departments together?
आईटी और ग्राहक सेवा विभागों में मिलाकर पुरुषों की कुल संख्या कितनी है?
(A) 687
(B) 768
(C) 786
(D) 876
Ans: C
Total number of males in IT and Customer service
=Question: 5
What is the ratio of the number of females in the HR and the Accounts departments together to the number of males in the same department together?
मानव संसाधन और लेखा विभागों में मिलाकर महिलाओं की संख्या का समान विभाग में मिलाकर पुरुषों की संख्या से अनुपात कितना है?
(A) 268 : 311
(B) 311 : 269
(C) 319 : 268
(D) 329 : 368
Ans: B
(Number of females in HR and Accounts) : (Number of males in HR and Accounts)
=
= (234 + 77) : (126 + 143) = 311 : 269.

Question: 1
In July, if 40% of the Gross revenue of the magazine was collected from advertisement, what was the amount of Gross revenue collected from advertisement in that particular month?
जुलाई में, यदि पत्रिका के सकल राजस्व का 40% विज्ञापन से एकत्र किया गया था, तो उस विशेष महीने में विज्ञापन से एकत्रित सकल राजस्व की राशि क्या थी?
(A) Rs. 144000
(B) Rs. 148000
(C) Rs. 172000
(D) Rs. 182000
Ans: C
Gross revenue of July collected from advertisement
= 362000 + 28000 + 40000
= 390000 + 40000 = 430000
Gross revenue collected from advertisement
=
= 4300 × 40 = Rs. 172000.
Question: 2
What is the difference between Net revenue of the magazine in April and its Gross revenue in June?
अप्रैल में पत्रिका के शुद्ध राजस्व और जून में उसके सकल राजस्व के बीच क्या अंतर है?
(A) Rs. 118000
(B) Rs. 124000
(C) Rs. 126000
(D) Rs. 136000
Ans: C
Net revenue in April = 320000 – 44000 = Rs. 276000
Gross revenue in June = 330000 + 72000 = Rs. 402000.
Required difference = 402000 – 276000 = Rs. 126000.
Question: 3
In May, the respective ratio of amount allocated for commission and amount allocated for discount and others was 4 : 3. What was the Gross revenue of the magazine in May?
मई में, कमीशन के लिए आवंटित राशि और छूट और अन्य के लिए आवंटित राशि का संबंधित अनुपात 4:3 था। मई में पत्रिका का सकल राजस्व क्या था?
(A) Rs. 380000
(B) Rs. 420000
(C) Rs. 430000
(D) Rs. 435000
Ans: B
In May, ratio of amount allocated for commission and
Amount allocated for discount = 4 : 3.
In May, amount allocated for commission = 4 × 12000 and 3 × 12000.
Amount allocated for discount = 48000 and 36000
∴ Gross revenue in May net revenue + amount allocated for commission = 336000 + 84000 = Rs. 420000.
Question: 4
Amount allocated for commission in March is what percent less than the amount allocated for commission in July?
मार्च में कमीशन के लिए आवंटित राशि जुलाई में कमीशन के लिए आवंटित राशि से कितना प्रतिशत कम है?
(A) 22%
(B) 24%
(C) 26%
(D) 28%
Ans: A
Amount collected for commission in March = 31200
Amount collected for commission in July = 40000.
Required percentage =
Question: 5
In March, if Net revenue of the magazine was 85% of its Gross revenue, what was the amount allocated for discount and others?
मार्च में, यदि पत्रिका का शुद्ध राजस्व उसके सकल राजस्व का 85% था, तो छूट और अन्य के लिए आवंटित राशि क्या थी?
(A) Rs. 22400
(B) Rs. 22800
(C) Rs. 23200
(D) Rs. 24200
Ans: B
In March,
Net revenue =
∴ Amount allocated for discount and others
= 360000 – 306000 – 31200 = 54000 – 31200 = 22800.
Tabulation (MCQ )
Number of Boys and Girls in Five Streams of a College Over the Years Streams
| Art | Science | Commerce | Management | IT | ||||||
| Year | Boys | Girls | Boys | Girls | Boys | Girls | Boys | Girls | Boys | Girls |
| 2002 | 556 | 414 | 619 | 505 | 668 | 612 | 770 | 633 | 670 | 515 |
| 2003 | 763 | 608 | 793 | 612 | 781 | 616 | 667 | 439 | 866 | 722 |
| 2004 | 672 | 519 | 540 | 516 | 859 | 713 | 778 | 727 | 781 | 619 |
| 2005 | 809 | 602 | 928 | 908 | 870 | 811 | 849 | 729 | 977 | 817 |
| 2006 | 745 | 510 | 884 | 820 | 967 | 819 | 562 | 938 | 990 | 808 |
| 2007 | 698 | 413 | 765 | 616 | 571 | 515 | 1288 | 1016 | 1151 | 1010 |
Directions: Study the following table carefully to answer the questions that follow:
No comments:
Post a Comment