MATHS & REASONING BY - DR V K OMAR
Bar graph DI Quiz to improve your Quantitative Aptitude for SBI Po & SBI clerk exam, IBPS PO & IBPS Clerk exam, IBPS RRB PO and assistant exam, LIC AAO LIC Assistant and other competitive exam.
Directions for Questions 1 to 3: Following bar chart shows the number of employees in 4 companies working in 4 departments: Marketing, Tech, Operations and Others.
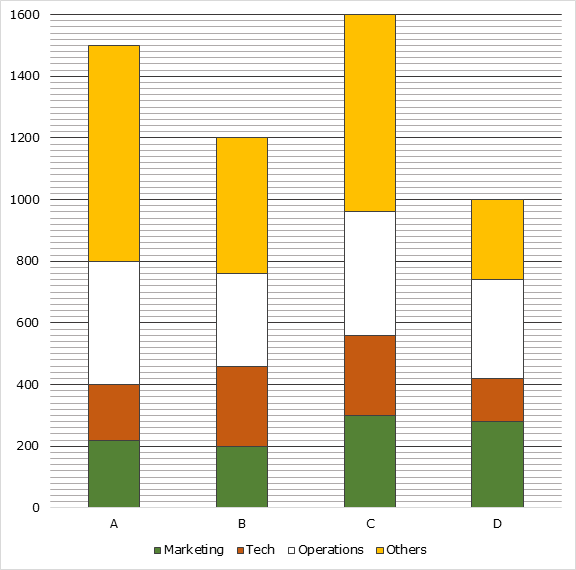
1. What percent of employees in company C are in operations?
1. कंपनी C में कितने प्रतिशत कर्मचारी परिचालन में हैं?
(1) 10%
(2) 15%
(3) 20%
(4) 25%
(5) 30%
2. What is the ratio of the difference between the number of employees working in tech and operations in company A to that in company B?
2. कंपनी A में टेक और संचालन में काम करने वाले कर्मचारियों की संख्या और कंपनी B में काम करने वाले कर्मचारियों की संख्या के बीच अंतर का अनुपात क्या है?
(1) 11:2
(2) 11:3
(3) 12:5
(4) 10:3
(5) 10:7
3. The sum of the number of employees in marketing and operations in company D is what percent greater than the sum of the number of employees in tech and others in the same company?
3. कंपनी D में मार्केटिंग और संचालन में कर्मचारियों की संख्या का योग उसी कंपनी में टेक और अन्य कर्मचारियों की संख्या के योग से कितना प्रतिशत अधिक है?
(1) 55%
(2) 50%
(3) 60%
(4) 45%
(5) 40%
SOLUTION:
Answer key to Q1: 4
Required percentage = (400/1600)*100% = 25%
Answer key to Q2: 1
Required ratio = (400 – 180) : (300 – 260) = 11:2
Answer key to Q3: 2
Sum of the number of employees in marketing and operations in company D = 280 + 320 = 600
Sum of the number of employees in tech and others in company D
= 140 + 260 = 400
Required percentage = ((600 – 400)/400)*100% = 50%
Directions for Questions 4 to 6: Study the following information carefully and answer the related questions.
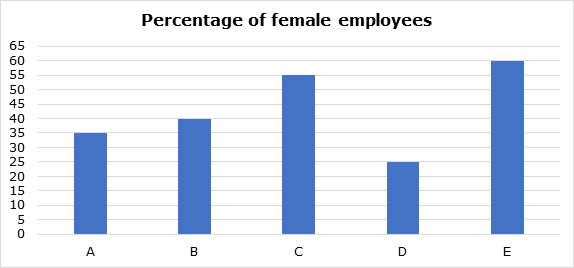
Following first bar graph represents the data regarding total number of employees (male + female) working in five different companies and second bar graph represents the percentage of female employees in the given company.
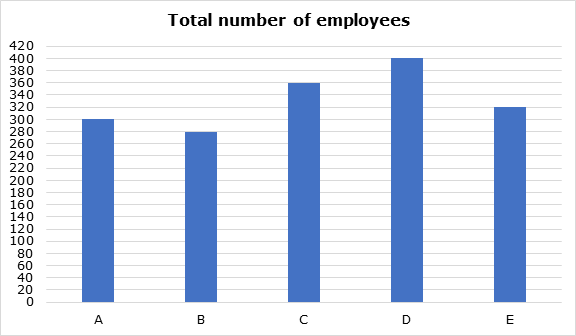
4. Total male employees in company B, D and E together are what percent of total employees in same company?
4. कंपनी B, D और E में कुल पुरुष कर्मचारी एक ही कंपनी में कुल कर्मचारियों का कितना प्रतिशत हैं?
(1) 56.4%
(2) 58.7%
(3) 59.6%
(4) 60.1%
(5) 60.8%
5. Total number of female employees in all companies together are how much more/less than total number of male employees?
5. सभी कंपनियों में मिलाकर महिला कर्मचारियों की कुल संख्या, पुरुष कर्मचारियों की कुल संख्या से कितनी अधिक/कम है?
(1) 246
(2) 198
(3) 224
(4) 240
(5) 212
6. If ‘m’ is the ratio of total male employees in company C and E together to total employees in company D and ‘n’ is the ratio of total female employees in company B and C together to total employees in company A, then what is the sum of m and n?
6. यदि 'm' कंपनी C और E के कुल पुरुष कर्मचारियों का कंपनी D के कुल कर्मचारियों से अनुपात है और 'n' कंपनी B और C में मिलाकर कंपनी A में कुल महिला कर्मचारियों का अनुपात है, तो एम और एन का योग क्या है?
(1) 4(23/60)
(2) 1(91/120)
(3) 2(63/80)
(4) 1(87/100)
(5) 2(4/47)
SOLUTION:
Total employees in company A = 300
Female employees in company A = 35% of 300 = 105
Male employees in company A = 300 – 105 = 195
Total employees in company B = 280
Female employees in company B = 40% of 280 = 112
Male employees in company B = 280 – 112 = 168
Total employees in company C = 360
Female employees in company C = 55% of 360 = 198
Male employees in company C = 360 – 198 = 162
Total employees in company D = 400
Female employees in company D = 25% of 400 = 100
Male employees in company D = 400 – 100 = 300
Total employees in company E = 320
Female employees in company E = 60% of 320 = 192
Male employees in company E = 320 – 192 = 128
Answer key to Q4: 3
Total employees in company B, D and E = 280 + 400 + 320 = 1000
Total male employees in company B, D and E = 168 + 300 + 128 = 596
Percentage = (596/1000) x 100 = 59.6%
Answer key to Q5: 1
Total number of female employees in all companies together
= 105 + 112 + 198 + 100 + 192 = 707
Total number of male employees in all companies together
= 195 + 168 + 162 + 300 + 128 = 953
Difference = 953 – 707 = 246
Answer key to Q6: 2
Total male employees in company C and E together = 162 + 128 = 290
Total employees in company D = 400
m = 290/400 = 29/40
Total female employees in company B and C together = 112 + 198 = 310
Total employees in company A = 300
n = 310/300 = 31/30
Therefore, m + n = (29/40) + (31/30) = 1(91/120)
Directions (1– 5): Study the following graphs and answer the given questions.
Number of Students Playing Carrom, Cricket and Hockey from Different Schools.

Q1. Total number of students playing Carrom and Hockey together from school P is what percent of the total number of students playing these two games together from school R?
Q1. स्कूल P से कैरम और हॉकी खेलने वाले विद्यार्थियों की कुल संख्या, स्कूल R से इन दोनों खेलों को मिलाकर खेलने वाले विद्यार्थियों की कुल संख्या का कितना प्रतिशत है?


Q2. If the number of students playing each game in school S is increased by 15% and the number of students playing each game in school Q is decreased by 5%, then what will be the difference between number of students in schools S and Q?
प्रश्न 2. यदि स्कूल S में प्रत्येक खेल खेलने वाले छात्रों की संख्या में 15% की वृद्धि की जाती है और स्कूल Q में प्रत्येक खेल खेलने वाले छात्रों की संख्या में 5% की कमी की जाती है, तो स्कूल S और Q में छात्रों की संख्या के बीच का अंतर क्या होगा?
(a) 54
(b) 218
(c) 356
(d) 224
(e) 205

Q3. If out of the students playing Cricket from schools Q, S and T 40%, 35% and 45% respectively got selected for state level competition, what was the total number of students playing cricket got selected for State level competition from these schools together?
Q3. यदि स्कूल Q, S और T से क्रिकेट खेलने वाले छात्रों में से क्रमशः 40%, 35% और 45% राज्य स्तरीय प्रतियोगिता के लिए चयनित हो जाते हैं, तो इन स्कूलों से एक साथ राज्य स्तरीय प्रतियोगिता के लिए क्रिकेट खेलने वाले छात्रों की कुल संख्या कितनी थी?
(a) 346
(b) 241
(c) 292
(d) 284
(e) 268

Q4. Total number of students playing Hockey from all schools together is approximately what percent of the total number of students playing Cricket from all schools together?
प्रश्न4. सभी विद्यालयों से मिलाकर हॉकी खेलने वाले विद्यार्थियों की कुल संख्या, सभी विद्यालयों से मिलाकर क्रिकेट खेलने वाले विद्यार्थियों की कुल संख्या का लगभग कितना प्रतिशत है?
(a) 84%
(b) 74%
(c) 72%
(d) 79%
(e) 70%

Q5. From school P, out of the students playing Carrom, 40% got selected for State level competition. Out of which 25% further got selected for National level competition. From school T, out of the students playing Carrom, 45% got selected for State level competition, out of which two-third further got selected for National level competition. What is the total number of students playing Carrom from these two schools who got selected for National level competition?
प्रश्न5. स्कूल P से कैरम खेलने वाले विद्यार्थियों में से 40% राज्य स्तरीय प्रतियोगिता के लिए चयनित हुए। जिसमें से 25% आगे राष्ट्रीय स्तर की प्रतियोगिता के लिए चयनित हुए। स्कूल टी से कैरम खेलने वाले विद्यार्थियों में से 45 प्रतिशत का राज्य स्तरीय प्रतियोगिता के लिए चयन हुआ, जिसमें से दो तिहाई आगे राष्ट्रीय स्तर की प्रतियोगिता के लिए चयनित हुए। इन दो स्कूलों से कैरम खेलने वाले छात्रों की कुल संख्या कितनी है जो राष्ट्रीय स्तर की प्रतियोगिता के लिए चयनित हुए हैं?
(a) 106
(b) 98
(c) 112
(d) 108
(e) 96

Directions (6-10): The following chart represent the percentage of profit by companies X, Y and Z in given six years.
Directions (6-10): निम्नलिखित चार्ट दिए गए छह वर्षों में कंपनियों X, Y और Z द्वारा लाभ के प्रतिशत को दर्शाता है।

6.If Income of X in 1992 is equal to expenditure of Y in 1994, what is the profit of X in 1992 if income of Y in 1994 is Rs. 7 Lac.
6.यदि 1992 में X की आय 1994 में Y के व्यय के बराबर है, 1992 में X का लाभ क्या है यदि 1994 में Y की आय रु। 7 लाख।
(a) 2,00,000
(b) 3,00,000
(c) 1,00,000
(d) 1,54,000
(e) None of these

7.What is the average income (in lakh approx.) of X in all these years if expenditure of X in 1991 is Rs 1 Lac and it increases by Rs. 50,000 every year?
7. इन सभी वर्षों में X की औसत आय (लाख में लगभग) क्या है, यदि 1991 में X का व्यय 1 लाख रुपये है और इसमें रुपये की वृद्धि होती है? हर साल 50,000?
(a) 2.14
(b) 3.146
(c) 3
(d) 3.5
(e) 4.2

8.In 1995, expenditure of x, y and z are in ratio 2:3:5. What will be the ratio of their profits?
8.1995 में, x, y और z का व्यय 2:3:5 के अनुपात में है। उनके लाभ का अनुपात क्या होगा?
(a) 1:6:5
(b) 2:5:6
(c) 1:3:2
(d) 2:3:2
(e) None of the above

9.Income of X in 1993 is Rs. 4,00,000 which is 20% less than the expenditure of Z in the same year. What is the approximate difference between their profits in that year?
9. 1993 में X की आय रु. 4,00,000 जो उसी वर्ष Z के व्यय से 20% कम है। उस वर्ष में उनके लाभ के बीच लगभग अंतर कितना है?
(a) 45000
(b) 15050
(c) 50000
(d) 40000
(e) 33333

- In which of the following two years, the average of profit percent of all three together are equal.?
- निम्नलिखित में से किस दो वर्षों में, तीनों का मिलाकर लाभ प्रतिशत का औसत बराबर है
(a) 1992 & 1996
(b)1993 & 1994
(c)1992 & 1994
(d) All of these
(e)None of the above

Directions (1-5): Study the following graph carefully to answer the questions that follow.

Number of criminals arrested by police in three cities in 6 successive years.
Q1. Total criminals arrested in Ghaziabad are what percent less than that of in Gurugram throughout the given years?
(a) 2%
(b) 6.2%
(c) 2.6%
(d) 3.6%
(e) 3%

Q2. What percent of criminals are arrested from New Delhi in 2011, 2013 and 2015 together?
(a) 32%
(b) 34%
(c) 38%
(d) 30%
(e) 28%

Q3. Find the average number of criminals arrested from all three cities in 2013.
(a) 710
(b) 600
(c) 620
(d) 700
(e) None of these

Q4. What is the ratio of total number of criminals arrested from Gaziabad, New Delhi and Gurugram in 2010, 2014 and 2012 respectively and that of from Gurugram, New Delhi and Gaziabad in 2013, 2015 and 2010 respectively?
(a) 1 : 2
(b) 3 : 2
(c) 2 : 1
(d) 1 : 3
(e) none of these

Q5. Find the difference in total number of criminals from New Delhi and Gurugram throughout the years.
(a) 55
(b) 50
(c) 80
(d) 60
(e) none of these

Direction (Q.6-10): Study the following graph and answer the questions.

Q6. In which of the following months, total no. of users of all three Social Sites is second highest?
(a) January
(b)June
(c)May
(d) April
(e)None of the above

Q7. No. of twitter users in May and June together is how much more or less than no. of facebook users in June?
(a) 6.67% more
(b) 6.67% less
(c) 8.7% less
(d) 8.7% more
(e) 5.68% less

Q8. What is the ratio between total users in March & April together and Facebook users all over the years ?
(a) 7 : 16
(b) 9 : 17
(c) 17 : 9
(d) 19 : 9
(e) 9 : 16

Q9. Total Facebook users in six months together are what percent of total Social Media users in six months together ?
(a) 65%
(b) 59.99%
(c) 61%
(d) 56.65%
(e) 55%

Q10. If total no. of Social Media Users increases in each category by 200% in December from January in the Same year, What is the difference between the Linkedin Users in March, May & June together and total users in December?
(a)180
(b)160
(c)190
(d)195
(e)165

Directions (1-5): The following bar graph shows the total number of persons participating in a survey from 5 different countries in year 2016. Study the graph and answer the questions that follows:

Q1. What is the average number of persons who are in favour of survey?
(a) 66,000
(b) 64,000
(c) 62,500
(d) 68,450
(e) None of these

Q2. From which country, maximum number of persons have participated in survey?
(a) India
(b) UK
(c) Russia
(d) China
(e) USA

Q3. The number of persons in favor of survey from India are what percent of number of persons in favor of survey from USA?
(a) 92%
(b) 95%
(c) 87.5%
(d) 82.5%
(e) 88.25%

Q4. The number of persons not in favor of survey from China are approximately what per cent more or less than the number of persons not in favor of survey from Russia?
(a) 20% less
(b) 20% more
(c) 25% less
(d) 25% more
(e) 30% more

Q5. What is the ratio of number of persons in favor of survey from India and Russia together to the number of persons in favor of survey from China and UK together?
(a) 4 : 5
(b) 5 : 4
(c) 3 : 5
(d) 5 : 3
(e) None of these

Directions (6-10): Study the following graph carefully to answer the questions that follows:
Income (Rs. in thousands) of three different persons in five different years is given in the given bar graph.

- Find the average income of person B overall years?
(a) 26000
(b) 31000
(c) 35000
(d) 22000
(e) None of these

Q7. What is the difference between total income of person A and that of person C overall years?
(a) 8000
(b) 10000
(c) 5000
(d) 4000
(e) None of these

Q8. Income of person A in year 2003 is what percent more or less than the income of B in the year 2003?
(a) less
(b) more
(c) 14 % less
(d) 14% more
(e) None of these

Q9. Find the ratio of total income of A in the years 2002 and 2004 together to the total income of C in the years 2001 and 2003 together?
(a) 13 : 6
(b) 4 : 9
(c) 7 : 11
(d) 11 : 7
(e) None of these

Q10. Total Income of person B in all the five years is how much percent more than the Total income of person A in all the five years?
(a)
(b)
(c) 10
(d) 12
(e) None of these

Bar graph DI Quiz to improve your Quantitative Aptitude for SBI Po & SBI clerk exam, IBPS PO & IBPS Clerk exam, IBPS RRB PO and assistant exam, LIC AAO LIC Assistant and other competitive exam.
Directions (1-5): Production of three different flavors of Soft-Drinks Pepsi, Thumbs Up & Sprite by Pepsi co. over three years (in lakhs).

Q1. For which of the following years, the % of rise or fall in production from previous years is maximum for Sprite?
(a) 2016
(b) 2014
(c) 2012
(d) 2008
(e) 2006

Q2. For which flavor was the average production maximum in given period?
(a) Sprite
(b) Pepsi
(c) Thumbs Up
(d) Both (a) and (b)
(e) None of these

Q3. Total production for Pepsi in 2010 & 2012 is what % of the total production of Thumbs Up in 2014 & 2010 together?
(a) 100%
(b) 110%
(c) 115%
(d) 120%
(e) None of these

Q4. What is the difference between the average production of Sprite in 2006, 2010 & 2016 and the average production of Sprite in 2008, 2010 & 2014?
(a) 20/3
(b) 19/3
(c) 17/3
(d) 16/3
(e) None of these

Q5. What was the approximate decline in the production of Thumbs Up in 2016 from 2006?
(a)16%
(b) 16 1/3%
(c) 16 ¾%
(d) 16 2/3%
(e) None of these

Directions (6-10): Following bar chart shows the number of candidates enrolled in entrance test of 3 different companies from 2012 to 2016 for the post of Quality controller. Study the data and answer the following questions.

Q6. Total number of candidates enrolled from 2014 to 2016 for Hero pvt ltd are what % more or less than the total number of candidates enrolled from 2012 to 2014 for Bharat gears pvt ltd? (Rounded off to two decimal points)
(a) 20.25%
(b) 19.08%
(c) 15.26%
(d) 30.05%
(e) None of these

Q7. What is the % decrease for candidates enrolled in Honda pvt ltd from 2013 to 2016? (Rounded off to two decimal points)
(a) 68%
(b) 56%
(c) 60%
(d) 62%
(e) 55%

Q8. Find the difference in average number of candidates enrolled in Honda pvt ltd and that in Bharat gears pvt ltd?
(a) 190
(b) 210
(c) 195
(d) 205
(e) None of these

Q9. 55% of the candidates enrolled in year 2015 are post-graduates then find the ratio of total candidates enrolled in 2012 to the non-post graduate candidates enrolled in 2015?
(a) 5:1
(b) 9:2
(c) 17:4
(d) 5:3
(e) None of these

Q10. Find the ratio of total candidates enrolled in 2013 to that in 2016?
(a) 157:85
(b) 155:87
(c) 155:84
(d) 157:84
(e) None of these

Directions (1-5): The bar graph given below shows the marks obtained by five students – Amit, Rishabh, Kaushal, Jyoti and Raksha in three subjects – Physics, Chemistry and Mathematics. The five students are disguised as S1, S2, S3, S4 and S5 randomly. Raksha’s total score in all the three subjects combined was 4 marks more than that of Rishabh. Amit obtained 50 marks in Chemistry and 5 marks more than Rishabh in Physics. Average marks of Jyoti in all three subjects is 38.4% of total marks of Rishabh.

Q1. What are the total marks obtained by Kaushal?
(a) 127
(b) 144
(c) 148
(d) 125
(e) None of these

Q2. By what percent total marks obtained by Kaushal is more or less than that of Jyoti?
(a) 8.5%
(b) 15.6%
(c) 10.81%
(d) 11.8%
(e) 13.2%

Q3. Find the difference in total marks scored in Chemistry and total marks scored by Raksha?
(a) 106
(b) 96
(c) 88
(d) 121
(e) None of these

Q4. By What percent Raksha beats Rishabh?
(a) 2.5%
(b) 4.3%
(c) 3.3%
(d) 5.8%
(e) 3.92%

Q5. Find the total marks scored by Rishabh in Chemistry, Raksha in Physics and Kaushal in Mathmatics.
(a) 148
(b) 135
(c) 137
(d) 142
(e) None of these

Directions (6-10): The bar-graph given below shows the speed of boat and the speed of stream. Study the table & answer the questions based on it. Each of the rivers has a boat that travels with a particular speed.

Q6. What is the total time taken by Rohan if he travels a distance of 18 kms both ways in river 1 and 21 km downstream in River 4?
(a) 5 hours
(b) 4 hours
(c) 3 hours
(d) 6 hours
(e) none of these

Q7. Ram & Shyam contest with each other for a 42 km race both ways. Ram choose River 1 whereas Shyam chooses River 5. In how much time will the winner complete the race?
(a) hrs.
(b) hrs.
(c) hrs.
(d) hrs.
(e) none of these

Q8. Banti uses an additional engine which can increase the speed of any boat by 20%. If Banti travels a distance of 40 km both ways in river 3, then find the ratio of the time taken by him when he uses the engine to the time, he would have taken had he not used the engine.
(a) 473:650
(b) 483:650
(c) 493:650
(d) 463:650
(e) none of these

Q9. Vikas wants to cover a distance of 20 km both ways either in River 2 or River 5. The boating charges per hour in River 2 is Rs. 5 and that in River 5 is Rs. 6. How much should he spend in order to minimize his expenses and which river should he choose?
(a) River 2 and Rs. 28.8
(b) River 5 and Rs. 35.5
(c) River 5 and Rs. 32.0
(d) River 2 and Rs. 23.8
(e) none of these

Q10. A person travelled an equal distance both ways in River 4. Find his average speed for the whole trip?
(a) 14 Km/h
(b) 13 Km/h
(c) 12 Km/h
(d) 15 Km/h
(e) none of these

Directions (1 – 5): Given below the bar graph shows the import and export of gold (in metric tonnes) in Hong Kong in five years.

1. Net flow of gold in 2010 is how much more than the net flow of gold in 2013?
(a) 120%
(b) 100%
(c) 200%
(d) 80%
(e) 150%

2. 30% of Imported gold in 2011, re–exported in 2012. Then what percent of gold is re–exported in 2012.
(a) 40%
(b) 42%
(c) 50%
(d) 120%
(e) 20%

3. What is the average of net flow of gold over the years?
(a) 150 M.T
(b) 100 M.T
(c) 10 M. T.
(d) 20 M. T
(e) 30 M. T

4. 60% of imported gold from all the years is re–exported in 2014, due to which a shortage of 55 metric tonnes of gold occurs. To complete this shortage how much percent of gold is imported w.r.t to exported gold in 2014.


5. What is the ratio of gold exported all over the years together to the gold imported all over the years together?
(a) 35 : 32
(b) 4 : 7
(c) 5 : 3
(d) 32 : 35
(e) 7 : 4

Directions (6- 10): Given below bar graph shows percentage increase and decrease in the purchasing and selling price of one Ripple in five different months of year 2017. Negative percentage shows decrease in price and positive percentage shows increase in price, with respect of previous month price
(Note- Purchasing price of one ripple in January 2017 was 240 Rs and Selling price was 280 Rs in same month).
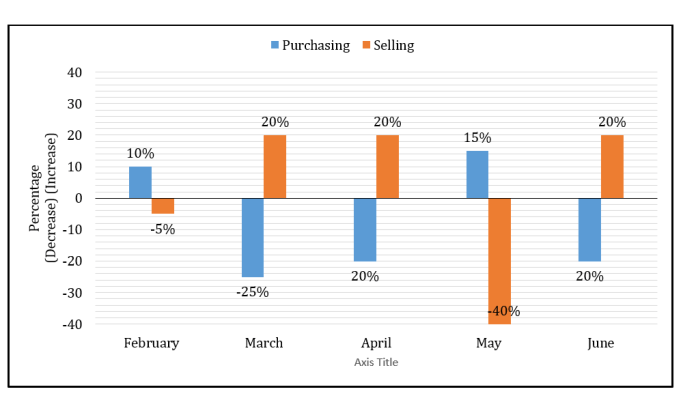
6. Abhinav purchased ten Ripple in month January and five Ripple in month of February and Sells all ripple in month April. Find total profit obtained by Aman?
(a) 2020.6 Rs
(b) 2025.6 Rs
(c) 2075. 6Rs
(d) 2035.6 Rs
(e) 2045.6 Rs

8. Purchasing price of one Ripple in month of march is approximately what percent less than selling price of one Ripple in month of April?
(a) 38%
(b) 56%
(c) 36%
(d) 42%
(e) 48%

9. Selling price of one Ripple in month of April?
(a) 1955 : 4788
(b) 1925 : 4788
(c) 9788 : 1955
(d) 1935 : 4688
(e) 3: 5

10. Purchasing price of one Ripple in month of may is approximately what percent of selling price of one Ripple in month of March?
(a) 49%
(b) 51%
(c) 57%
(d) 63%
(e) 65%

No comments:
Post a Comment