Answer: Option D Explanation: The exports are more than the imports imply that the ratio of value of imports to exports is less than 1. Now, this ratio is less than 1 in years 1995, 1996, 1997 and 2000. Thus, there are four such years. Study the following line graph and answer the questions based on it. Number of Vehicles Manufactured by Two companies ove the Years (Number in Thousands) 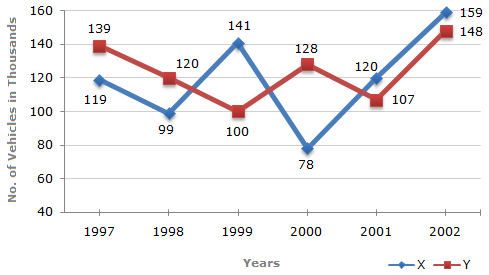
| 1. | What is the difference between the number of vehicles manufactured by Company Y in 2000 and 2001 ? | Answer: Option D Explanation: Required difference = (128000 - 107000) = 21000. |
| 2. | What is the difference between the total productions of the two Companies in the given years ? | Answer: Option C Explanation: From the line-graph it is clear that the productions of Company X in the years 1997, 1998, 1999, 2000, 2001 and 2002 are 119000, 99000, 141000, 78000, 120000 and 159000 and those of Company Y are 139000, 120000,100000, 128000, 107000 and 148000 respectively. Total production of Company X from 1997 to 2002 = 119000 + 99000 + 141000 + 78000 + 120000 + 159000 = 716000. and total production of Company Y from 1997 to 2002 = 139000 + 120000 + 100000 + 128000 + 107000 + 148000 = 742000. Difference = (742000 - 716000) = 26000.
|
| 3. | What is the average numbers of vehicles manufactured by Company X over the given period ? (rounded off to nearest integer) | Answer: Option A Explanation: Average number of vehicles manufactured by Company X | = | 1 | x (119000 + 99000 + 141000 + 78000 + 120000 + 159000) | | 6 |
= 119333.
|
| 4. | In which of the following years, the difference between the productions of Companies X and Y was the maximum among the given years ? | Answer: Option D Explanation: The difference between the productions of Companies X and Y in various years are: For 1997 (139000 - 119000) = 20000. For 1998 (120000 - 99000) = 21000. For 1999 (141000 - 100000) = 41000. For 2000 (128000 - 78000) = 50000. For 2001 (120000 - 107000) = 13000. For 2002 (159000 - 148000) = 11000. Clearly, maximum difference was in 2000.
|
| 5. | The production of Company Y in 2000 was approximately what percent of the production of Company X in the same year ? | Answer: Option B Explanation: | Required percentage = |  | 128000 | x 100 |  | %  164%. 164%. | | 78000 |
|
The following line graph gives the percent profit earned by two Companies X and Y during the period 1996 - 2001. Percentage profit earned by Two Companies X and Y over the Given Years | %Profit = | Income - Expenditure | x 100 | | Expenditure |
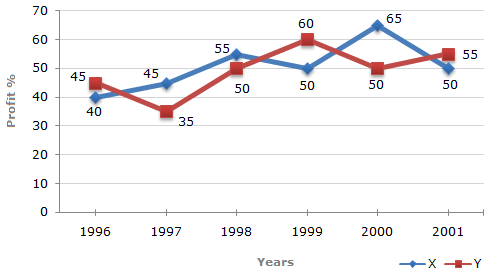
| 1. | The incomes of two Companies X and Y in 2000 were in the ratio of 3:4 respectively. What was the respective ratio of their expenditures in 2000 ? |
|
| 2. | If the expenditure of Company Y in 1997 was Rs. 220 crores, what was its income in 1997 ? | | A. | Rs. 312 crores | | B. | Rs. 297 crores | | C. | Rs. 283 crores | | D. | Rs. 275 crores |
|
| 3. | If the expenditures of Company X and Y in 1996 were equal and the total income of the two Companies in 1996 was Rs. 342 crores, what was the total profit of the two Companies together in 1996 ? (Profit = Income - Expenditure) | | A. | Rs. 240 crores | | B. | Rs. 171 crores | | C. | Rs. 120 crores | | D. | Rs. 102 crores |
|
| 4. | The expenditure of Company X in the year 1998 was Rs. 200 crores and the income of company X in 1998 was the same as its expenditure in 2001. The income of Company X in 2001 was ? | | A. | Rs. 465 crores | | B. | Rs. 385 crores | | C. | Rs. 335 crores | | D. | Rs. 295 crores |
|
| 5. | If the incomes of two Comapanies were equal in 1999, then what was the ratio of expenditure of Company X to that of Company Y in 1999 ? | |
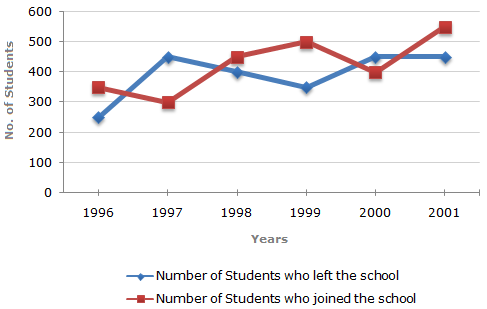
The following line graph gives the percentage of the number of candidates who qualified an examination out of the total number of candidates who appeared for the examination over a period of seven years from 1994 to 2000. Percentage of Candidates Qualified to Appeared in an Examination Over the Years 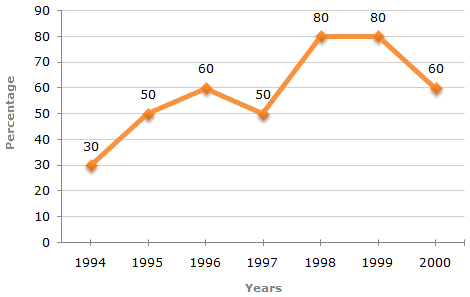
| 1. | The difference between the percentage of candidates qualified to appeared was maximum in which of the following pairs of years? | | A. | 1994 and 1995 | | B. | 1997 and 1998 | | C. | 1998 and 1999 | | D. | 1999 and 2000 |
Answer: Option B Explanation: The differences between the percentages of candidates qualified to appeared for the give pairs of years are: For 1994 and 1995 = 50 - 30 = 20. For 1998 and 1999 = 80 - 80 = 0. For 1994 and 1997 = 50 - 30 = 20. For 1997 and 1998 = 80 - 50 = 30. For 1999 and 2000 = 80 - 60 = 20. Thus, the maximum difference is between the years 1997 and 1998.
|
| 2. | In which pair of years was the number of candidates qualified, the same? | | A. | 1995 and 1997 | | B. | 1995 and 2000 | | C. | 1998 and 1999 | | D. | Data inadequate |
Answer: Option D Explanation: The graph gives the data for the percentage of candidates qualified to appeared and unless the absolute values of number of candidates qualified or candidates appeared is know we cannot compare the absolute values for any two years. Hence, the data is inadequate to solve this question.
|
| 3. | If the number of candidates qualified in 1998 was 21200, what was the number of candidates appeared in 1998? | Answer: Option C Explanation: The number of candidates appeared in 1998 be x. Then, 80% of x = 21200  x = x = | 21200 x 100 | = 26500 (required number). | | 80 |
|
| 4. | If the total number of candidates appeared in 1996 and 1997 together was 47400, then the total number of candidates qualified in these two years together was? | Answer: Option D Explanation: The total number of candidates qualified in 1996 and 1997 together, cannot be determined until we know at least, the number of candidates appeared in any one of the two years 1996 or 1997 or the percentage of candidates qualified to appeared in 1996 and 1997 together. Hence, the data is inadequate.
|
| 5. | The total number of candidates qualified in 1999 and 2000 together was 33500 and the number of candidates appeared in 1999 was 26500. What was the number of candidates in 2000? | Answer: Option C Explanation: The number of candidates qualified in 1999 = (80% of 26500) = 21200.  Number of candidates qualified in 2000 = (33500 - 21200) = 12300. Number of candidates qualified in 2000 = (33500 - 21200) = 12300.
Let the number of candidates appeared in 2000 be x. | Then, 60% of x = 12300 x = | | 12300 x 100 | | = 20500. | | 60 |
|
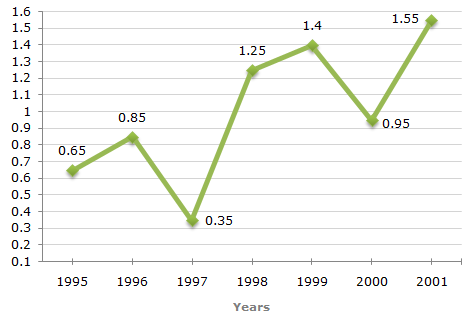
The following line graph gives the annual percent profit earned by a Company during the period 1995 - 2000. Percent Profit Earned by a Company Over the Years. | %Profit = | Income - Expenditure | x 100 | | Expenditure |
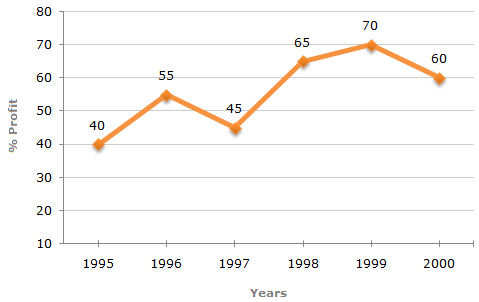
| 1. | If the expenditures in 1996 and 1999 are equal, then the approximate ratio of the income in 1996 and 1999 respectively is? | Answer: Option D Explanation:
|
| 2. | If the income in 1998 was Rs. 264 crores, what was the expenditure in 1998? | | A. | Rs. 104 crores | | B. | Rs. 145 crores | | C. | Rs. 160 crores | | D. | Rs. 185 crores |
Answer: Option C Explanation: Let the expenditure is 1998 be Rs. x crores. | | 65 | = | 264 | - 1 | | 100 | x |
| x = | 264 x 100 | = 160. | | 165 |
Expenditure in 1998 = Rs. 160 crores.
|
| 3. | In which year is the expenditure minimum? | | A. | 2000 | | B. | 1997 | | C. | 1996 | | D. | Cannot be determined |
Answer: Option D Explanation: The line-graph gives the comparison of percent profit for different years bu the comparison of the expenditures is not possible without more data. Therefore, the year with minimum expenditure cannot be determined.
|
| 4. | If the profit in 1999 was Rs. 4 crores, what was the profit in 2000? | | A. | Rs. 4.2 crores | | B. | Rs. 6.6 crores | | C. | Rs. 6.8 crores | | D. | Cannot be determined |
Answer: Option D Explanation: From the line-graph we obtain information about the percentage profit only. To find the profit in 2000 we must have the data for the income or expenditure in 2000. Therefore, the profit for 2000 cannot be determined.
|
| 5. | What is the average profit earned for the given years? | Answer: Option B Explanation: Average percent profit earned for the given years | = | 1 | x [40 + 55 + 45 + 65 + 70 + 60] = | 335 | = 55 | 5 | . | | 6 | 6 | 6 |
|
Answer the questions based on the given line graph. Ratio of Exports to Imports (in terms of money in Rs. crores) of Two Companies Over the Years 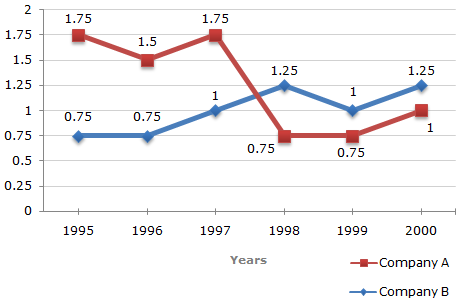
| 1. | In how many of the given years were the exports more than the imports for Company A? | Answer: Option B Explanation: The exports are more than imports in those years for which the exports to imports ratio are more than 1. For Company A, such years are 1995, 1996 and 1997. Thus, during these 3 years, the exports are more than the imports for Company A.
|
| 2. | If the imports of Company A in 1997 were increased by 40 percent, what would be the ratio of exports to the increased imports? | | A. | 1.20 | | B. | 1.25 | | C. | 1.30 | | D. | cannot be determined |
Answer: Option B Explanation: In 1997 for Company A we have: where E amount of exports, I = amount of imports of Company A in 1997. Now, the required imports I1 = I + 40% of I = 1.4I. | Required ratio = | E | = | 1.75I | = 1.25. | | I1 | 1.4I |
|
| 3. | If the exports of Company A in 1998 were Rs. 237 crores, what was the amount of imports in that year? | | A. | Rs. 189.6 crores | | B. | Rs. 243 crores | | C. | Rs. 281 crores | | D. | Rs. 316 crores |
Answer: Option D Explanation: Let the amount of imports of Company A in 1998 be Rs. x crores. | Then, | 237 | = 0.75 x = | 237 | = 316. | | x | 0.75 |
Amount of imports of Company A in 1998 = Rs. 316 crores.
|
| 4. | In 1995, the export of Company A was double that of Company B. If the imports of Company A during the year was Rs. 180 crores, what was the approximate amount of imports pf Company B during that year? | | A. | Rs. 190 crores | | B. | Rs. 210 crores | | C. | Rs. 225 crores | | D. | Cannot be determined |
Answer: Option B Explanation: In 1995 for Company A we have: [where EA = amount of exports, IA = amount of imports of Company a in 1995] In 1995 for Company B we have: [where EB = amount of exports, IB = amount of imports of Company B in 1995] Also, we have EA = 2EB ... (iii) Substituting IA = Rs. 180 crores (given) in (i), we get: EA = Rs. (180 x 1.75) crores = Rs. 315 crores. Using EA = Rs. 315 crores in (iii), we get: | EB = | EA | = Rs. | | 315 | | crores. | | 2 | 2 |
| Substituting EB = Rs. | | 315 | | crores in (ii), we get: | | 2 |
| IB = | EB | = Rs. | | 315 | | crores = Rs. 210 crores. | | 0.75 | 2 x 0.75 |
i.e., amount of imports of Company B in 1995 = Rs. 210 crores.
|
| 5. | In which year(s) was the difference between impors and exports of Company B the maximum? | | A. | 2000 | | B. | 1996 | | C. | 1998 and 2000 | | D. | Cannot be determined |
Answer: Option D Explanation: We shall try to find the difference between the imports and exports of Company B for various years one by one: For 1995: We have where E = amount of exports, I = amount of imports in 1995. E = 0.75I I - E = 0.75 x I = 0.25I. Thus, the difference between the imports and exports of Company B in 1995 is dependent on the amount of imports of Company B in 1995. Similarly, the difference for other years can be determined only if the amount of imports for these years is known. Since the imports or exports for various years are not know, the differences between and exports for various years cannot be determined. |
Two different finance companies declare fixed annual rate of interest on the amounts invested with them by investors. The rate of interest offered by these companies may differ from year to year depending on the variation in the economy of the country and the banks rate of interest. The annual rate of interest offered by the two Companies P and Q over the years are shown by the line graph provided below. Annual Rate of Interest Offered by Two Finance Companies Over the Years. 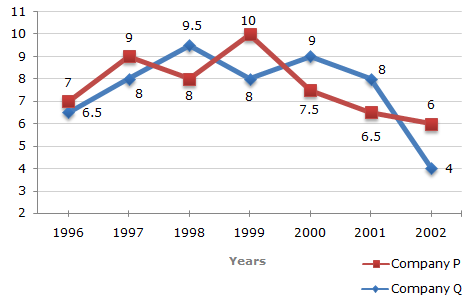
| 1. | A sum of Rs. 4.75 lakhs was invested in Company Q in 1999 for one year. How much more interest would have been earned if the sum was invested in Company P? | | A. | Rs. 19,000 | | B. | Rs. 14,250 | | C. | Rs. 11,750 | | D. | Rs. 9500 |
Answer: Option D Explanation: | Difference | = Rs. [(10% of 4.75) - (8% of 4.75)] lakhs | | = Rs. (2% of 4.75) lakhs | | = Rs. 0.095 lakhs | | = Rs. 9500. |
|
| 2. | If two different amounts in the ratio 8:9 are invested in Companies P and Q respectively in 2002, then the amounts received after one year as interests from Companies P and Q are respectively in the ratio? | Answer: Option D Explanation:
|
| 3. | In 2000, a part of Rs. 30 lakhs was invested in Company P and the rest was invested in Company Q for one year. The total interest received was Rs. 2.43 lakhs. What was the amount invested in Company P? | | A. | Rs. 9 lakhs | | B. | Rs. 11 lakhs | | C. | Rs. 12 lakhs | | D. | Rs. 18 lakhs |
Answer: Option D Explanation:
|
| 4. | An investor invested a sum of Rs. 12 lakhs in Company P in 1998. The total amount received after one year was re-invested in the same Company for one more year. The total appreciation received by the investor on his investment was? | | A. | Rs. 2,96,200 | | B. | Rs. 2,42,200 | | C. | Rs. 2,25,600 | | D. | Rs. 2,16,000 |
Answer: Option C Explanation: Amount received from Company P after one year (i.e., in 199) on investing Rs. 12 lakhs in it = Rs. [12 + (8% of 12)] lakhs = Rs. 12.96 lakhs. Amount received from Company P after one year on investing Rs. 12.96 lakhs in the year 1999 = Rs. [12.96 + (10% of 12.96)] lakhs = Rs. 14.256. Appreciation received on investment during the period of two years = Rs. (14.256 - 12) lakhs = Rs. 2.256 lakhs = Rs. 2,25,600.
|
| 5. | An investor invested Rs. 5 lakhs in Company Q in 1996. After one year, the entire amount along with the interest was transferred as investment to Company P in 1997 for one year. What amount will be received from Company P, by the investor? | | A. | Rs. 5,94,550 | | B. | Rs. 5,80,425 | | C. | Rs. 5,77,800 | | D. | Rs. 5,77,500 |
Answer: Option B Explanation: Amount received from Company Q after one year on investment of Rs. 5 lakhs in the year 1996 = Rs. [5 + (6.5% of 5)] lakhs = Rs. 5.325 lakhs. Amount received from Company P after one year on investment of Rs. 5.325 lakhs in the year 1997 = Rs. [5.325 + (9% of 5.325)] lakhs = Rs. 5.80425 lakhs = Rs. 5,80,425. |
|

![]](https://www.indiabix.com/_files/images/data-interpretation/common/15-sym-cbracket-h1.gif)
No comments:
Post a Comment