Tuesday, 23 August 2022

science


1- dk;Z dk ek=d gS

¼a½ twy         ¼b½ U;wVu      ¼c½ Mkbu    ¼d½  okV

2- izdk”k o’kZ bdkbZ gS

¼a½ nwjh dk     ¼b½ le; dh    ¼c½ izdk”k dh rhozrk dk   ¼d½ nzO;eku dh

3- fuEufyf[kr esa ls le; dk ek=d ugh gS

¼a½ vf/k o’kZ    ¼b½ pUnz ekg   ¼c½ izdk”k o’kZ   ¼d½ dksbZ ugh

4- ikjlsd bdkbZ gS

¼a½ nwjh dh   ¼b½ le; dh   ¼c½ izdk”k dh ped dh  ¼d½ pqEcdh; cy dh

5- fuEufyf[kr esa ls dkSu lk ,d lqesfyr ugh gS

¼a½ Mslhcsy      & /ofu dh izcyrk dh bdkbZ

¼b½ v”o “kfDr   & “kfDr dh bdkbZ

¼c½ leqnzh ehy   & ukSlapyku esa nwjh dh bZdkbZ

¼d½ lsfYl;l     & Å’ek dh bdkbZ

6- Y;wesu fdldk ek=d gS

¼a½ T;ksfr rhsozrk dk     ¼b½ T;ksfr ¶yDl dk

¼c½ mi;qZDr nksuks dk      ¼d½ dkbZ ughs

7- D;wjh fdldk ek=d gS

¼a½ jsfM;ks,fDVo /kfeZrk     ¼b½ rkiØe

¼c½ Å’ek                        ¼d½ ÅtkZ

8- nkc dk ek=d gS

¼a½ ikLdy               ¼b½ Mkbu

¼c½ vxZ                  ¼d½ twy

9- dS.Msyk ek=d gS

¼a½ T;ksfr ¶yDl         ¼b½ T;ksfr izHkko

¼c½ T;ksfr nkc            ¼d½ T;ksfr rhozrk

10- ek=dksa esa vUrjkZ’Vªh; i)fr dc ykxw gqbZ Fkh

¼a½ 1969 bZ0    ¼b½ 1971 bZ0   ¼c½ 1983 bZ0   ¼d½ 1991 bZ0

11- [kk| ÅtkZ dks ge fdl bdkbZ esa eki ldrs gS

¼a½ dSyksjh       ¼b½ dsfYou       ¼c½ twy    ¼d½ vxZ

12- ,l vkbZ i)fr esa ysl dh “kfDr dh bdkbZ D;k gS

¼a½  okV      ¼b½ Mk;ksIVj ¼c½ vkWIVj   ¼d½ ehVj

13- Mslhcsy fdls ekiuws ds fy; iz;ksx fd;k tkrk gS

¼a½ [kwu esa gheksXyksfcu             ¼b½ is”kkc esa “kDdj

¼c½ okrkoj.k esa /ofu              ¼d½ ok;q esa d.k

14- ,Eih;j D;k ekius dh bZdkbZ gS

¼a½ oksYVst       ¼b½ djsUV    ¼c½ izfrjks/k   ¼d½ ikoj

15- fuEufyf[kr esa ls fdlds chp dh vkSlr nwjh dks *[kxksyh; ,dd* dgk tkrk gS

¼a½ i`Foh vkSj lw;Z                 ¼b½ i`Foh vkSj pUnzek

¼c½ c`gLifr vkSj lw;Z              ¼d½ IywVks vkSj lw;Z

16- fuEufyf[kr esa ls dkSu osDVj jkf”k gS

¼a½ cy     ¼b½ pky     ¼c½ ÅtkZ    ¼d½ rkieku

17- “kwU; esa Lora= :I ls fxjus okyh oLrqvksa dh@dk ----- gS

¼a½ leku xfr gksrh gS             ¼b½ leku osx gksrk gS

¼c½ leku Roj.k gksrk gS            ¼d½ leku cy gksrk gS

18- ,d yM+dh >wys ij cSBh fLFkfr esa >wyk >wy jgh gSA ml yM+dh ds [kM+s gks tkus ij nksyuksa dk vkorZ gksxk

¼a½ de gks tk,xk                 ¼b½  vf/kd gks tk,xk

¼c½ yM+dh dh ÅWpkbZ ij fuHkZj djsxk ¼d½ vifjofrZr jgsxk

19- ?kw.kZu xfr djrh ,d xksy est ij vpkud ,d yM+dk vkdj cSB tkrk gSA est ds dks.kh; osx ij D;k izHkko gksxk

¼a½ de gks tk,xk         ¼b½ c<+ tk,xk

¼c½ mruk gh jgsxk        ¼d½ dqN ugh dgk tk ldrk

20- ;fn fdlh oLrq dk osx nqxquk dj fn;k tk, rks

¼a½ laosx nqxquk gks tkrk gS

¼b½ xfrt ÅtkZ pkj xquh gks tkrh gS

¼c½ mi;qZDr nksuksa lgh gS

¼d½ buesa ls dksbZ ugh

21- fdlh fi.M ds nzO;eku rFkk Hkkj esa vUrj gksrk gS D;ksfd

¼a½ nzO;eku ifjorZuh; gksrk gS] tcfd Hkkj fLFkj gksrk gS

¼b½ nzO;eku fLFkj gksrk gS] tcfd Hkkj ifjorZuh; gksrk gS

¼c½ nksuksa lR; gS

¼d½ nksuks xyr gS

22- fdlh vlUrqfyr cy }kjk fdlh fi.M esa mRiUu Roj.k

¼a½ cy ds O;qRØekuqikrh gksrk gS

¼b½ cy ds vuqØekuqikrh gksrk gS

¼c½ cy ds izHkko ls Lora= gksrk gS

¼d½ “kwU; gksrk gS

23- U;wVu ds igys fu;e dks Hkh dgrs gS

¼a½ vk/kw.kZ dk fu;e               ¼b½ tM+Ro dk fu;e

¼c½ ÅtkZ dk fu;e                ¼d½ laosx dk fu;e

24- jkWdsV dh dk;Z iz.kkyh fdl fl)kUr ij vk/kkfjr gksrh gS

¼a½ lkis{krk ds fl)kUr            ¼b½ U;wVu ds izFke fu;e

¼c½ U;wVu dk nwljk fu;e          ¼d½ U;wVu dk rhljk fu;e

25- v”o ;fn ,dk,d pyuk izkjEHk dj ns rks v”okjksgh ds fxjus dh vk”kadk dk dkj.k gS

¼a½ tM+Ro vk?kw.kZ          ¼b½ nzO;eku dk laj{k.k fu;e

¼c½ ÅtkZ laj{k.k          ¼d½ dks.kh; laosx laj{k.k


Sunday, 31 July 2022

PI CHART

MATHS & REASONING BY-DR V.K.OMAR


 Direction (1-5): Date given below shows number of girls in six different schools. Some data is given in absolute value while some in percentage. Study the data carefully and answer the following questions.

निर्देश (1-5): नीचे दी गई तिथि छह अलग-अलग स्कूलों में लड़कियों की संख्या दर्शाती है। कुछ डेटा निरपेक्ष मान में दिया जाता है जबकि कुछ प्रतिशत में। डेटा का ध्यानपूर्वक अध्ययन करें और निम्नलिखित प्रश्नों के उत्तर दें।

Pie Chart DI Basic Quantitative Aptitude Quiz for All Banking Exams- 31st May_50.1

Q1. Find the central angle of girls in school B?
(a) 57.6°
(b) 64.8°
(c) 72°
(d) 79.2°
(e) 86.4°

Q2. Total number of girls in school ‘D’ is how much more than total number of girls in school ‘E’?
(a) 264
(b) 297
(c) 330
(d) 363
(e) 396

Q3. Find the total number of girls in school ‘A’ and ‘D’ together?
(a) 1364
(b) 1386
(c) 1408
(d) 1430
(e) 1452

Q4. If ratio between number of girls and number of boys in school ‘F’ is 9 : 8, then find total number of students in school ‘F’.

यदि स्कूल 'F' में लड़कियों की संख्या और लड़कों की संख्या का अनुपात 9:8 है, तो स्कूल 'F' में छात्रों की कुल संख्या ज्ञात कीजिए।
(a) 561
(b) 550
(c) 528
(d) 539
(e) 572

Pie Chart DI Basic Quantitative Aptitude Quiz for All Banking Exams- 31st May_60.1

Pie Chart DI Basic Quantitative Aptitude Quiz for All Banking Exams- 31st May_70.1

Q7. Find the central angle of population of village D & E together?
(a) 148°
(b) 154°
(c) 166°
(d) 160°
(e) 162°

Q8. If total population of another village Q is 65 % of total population of village C and ratio between male population to female population in village Q is 4 : 9. Then find total female population in village Q?
(a) 805
(b) 810
(c) 840
(d) 880
(e) 960

Q9. If total literate population of village D is equal to 75 % of total population of village B. then find percentage of illiterate population in village D?
(a) 54.25%
(b) 52 .25%
(c) 58.25%
(d) 56.25 %
(e) 50.25%

Q10. Find the ratio between total population of village E to total population of village B?
(a) 5 : 7
(b) 6 : 11
(c) 6 : 7
(d 6 : 5
(e) 5 : 12

Directions (11-15): The given pie chart shows percentage distribution of various expense of a family in a given month.
Study the graph carefully and answer the following questions.

दिया गया पाई चार्ट एक महीने में एक परिवार के विभिन्न खर्चों का प्रतिशत वितरण दर्शाता है।

ग्राफ का ध्यानपूर्वक अध्ययन करें और निम्नलिखित प्रश्नों के उत्तर दें।

Pie Chart DI Basic Quantitative Aptitude Quiz for All Banking Exams- 31st May_80.1

Q11. What is the average expense on Rent, Electricity bill and Others?

किराया, बिजली बिल और अन्य पर औसत खर्च क्या है?
Rs 5000
Rs 3000
Rs 3750
Rs 2750
Rs 3250

Pie Chart DI Basic Quantitative Aptitude Quiz for All Banking Exams- 31st May_90.1

Q15. Find central angle (in degrees) of monthly expense of family on electricity bill.
(a) 76.4
(b) 68.6
(c) 32.8
(d) 54.6
(e) 43.2

Solutions

Pie Chart DI Basic Quantitative Aptitude Quiz for All Banking Exams- 31st May_110.1

Pie Chart DI Basic Quantitative Aptitude Quiz for All Banking Exams- 31st May_120.1

Pie Chart DI Basic Quantitative Aptitude Quiz for All Banking Exams- 31st May_130.1

Pie Chart DI Basic Quantitative Aptitude Quiz for All Banking Exams- 31st May_140.1

The following pie charts exhibit the distribution of the overseas tourist traffic from India. The two charts shows the tourist distribution by country and the age profiles of the tourists respectively.

निम्नलिखित पाई चार्ट भारत से विदेशी पर्यटक यातायात के वितरण को प्रदर्शित करते हैं। दो चार्ट देश के अनुसार पर्यटकों के वितरण और पर्यटकों की आयु प्रोफाइल को क्रमशः दर्शाते हैं।

Distribution of Overseas Tourist Traffic from India.

1. 

What percentage of Indian tourist went to either USA or UK ?

A.40 %
B.50 %
C.60 %
D.70 %

Answer: Option B

Explanation:

(40+10) = 50% (from first chart)


2. 

The ratio of the number of Indian tourists that went to USA to the number of Indian tourists who were below 30 years of age is ?

A.2:1
B.8:3
C.3:8
D.Cannot be determined

Answer: Option B

Explanation:

40:15 = 8:3


3. 

If amongst other countries, Switzerland accounted for 25% of the Indian tourist traffic, and it is known from official Swiss records that a total of 25 lakh Indian tourists had gone to Switzerland during the year, then find the number of 30-39 year old Indian tourists who went abroad in that year ?

यदि अन्य देशों में, स्विटज़रलैंड में भारतीय पर्यटक यातायात का 25% हिस्सा है, और आधिकारिक स्विस रिकॉर्ड से यह ज्ञात है कि वर्ष के दौरान कुल 25 लाख भारतीय पर्यटक स्विट्जरलैंड गए थे, तो 30-39 वर्ष के पुराने पर्यटकों की संख्या ज्ञात कीजिए। उस वर्ष विदेश जाने वाले भारतीय पर्यटक ?

A.18.75 lakh
B.25 lakh
C.50 lakh
D.75 lakh

Answer: Option D

Explanation:

Tourist traffic from other countries to Swiz is 20%.

Amongst this 20%, 25% of traffic from India.

So, 25% of 20% = 5% corresponds to the Indian traffic in Switzerland.

5 % corresponds to Switzerland's 25 lakh. Hence 15% will be 75 lakh.

The following pie chart give the information about the distribution of weight in the human body according to different kinds of components. Study the pie charts and answer the question.

निम्नलिखित पाई चार्ट विभिन्न प्रकार के घटकों के अनुसार मानव शरीर में वजन के वितरण के बारे में जानकारी देता है। पाई चार्ट का अध्ययन करें और प्रश्न का उत्तर दें।

Distribution of Weight in Human Body

1. 

What percentage of proteins of the human body is equivalent to the weight of its skin ?

A.41.66 %
B.43.33 %
C.44.44 %
D.Cannot be determined

Answer: Option A

Explanation:

Total percentage = (10 / 24) x 100 = 41.6666667 %


2. 

How much of the human body is neither made of bones or skin ?

A.40 %
B.50 %
C.60 %
D.70 %

Answer: Option D

Explanation:

20 + 10 = 30% is made up of either bones or skin. Hence, 70% is made up of neither.


3. 

What is the ratio of the distribution of proteins in the muscles to that of the distribution of proteins in the bones ?

A.2:1
B.2:3
C.3:2
D.Cannot be determined

Answer: Option D

Explanation:

It cannot be determined since the respective distributions are not known.

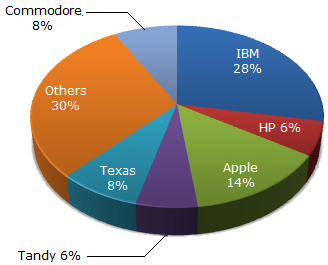
The pie chart shows the distribution of New York market share by value of different computer companies in 2005.

The pie chart shows the distribution of New York market share by volume of different computer companies in 2005.

Number of units sold in 2005 in New York = 1,500

Value of units sold in 2005 in New York = US $1,650,000.

1. 

For the year 2005, which company has realised the lowest average unit sales price for a PC ?

A.Commodore
B.IBM
C.Tandy
D.Cannot be determined


2. 

Over the period 2005-2006, if sales (value-wise) of IBM PC's increased by 50% and of Apple by 15% assuming that PC sales of all other computer companies remained the same, by what percentage (approximately) would the PC sales in New York (value-wise) increase over the same period ?

2005-2006 की अवधि में, यदि आईबीएम पीसी की बिक्री (मूल्य-वार) में 50% और एप्पल की 15% की वृद्धि हुई, यह मानते हुए कि अन्य सभी कंप्यूटर कंपनियों की पीसी बिक्री समान रही, तो पीसी की बिक्री कितने प्रतिशत (लगभग) होगी न्यूयॉर्क में (मूल्य-वार) इसी अवधि में वृद्धि हुई है?

A.16.1 %
B.18 %
C.14 %
D.None of these


3. 

In 2005, the average unit sale price of an IBM PC was approximately (in US$)

A.3180
B.2800
C.393
D.3080

The following pie-chart shows the sources of funds to be collected by the National Highways Authority of India (NHAI) for its Phase II projects. Study the pie-chart and answers the question that follow.

निम्नलिखित पाई-चार्ट भारतीय राष्ट्रीय राजमार्ग प्राधिकरण (एनएचएआई) द्वारा अपनी द्वितीय चरण की परियोजनाओं के लिए एकत्र किए जाने वाले धन के स्रोतों को दर्शाता है। पाई-चार्ट का अध्ययन करें और उसके बाद आने वाले प्रश्नों के उत्तर दें।

Sources of funds to be arranged by NHAI for Phase II projects (in crores Rs.)

1. 

Near about 20% of the funds are to be arranged through:

A.SPVS
B.External Assistance
C.Annuity
D.Market Borrowing

Answer: Option B

Explanation:

20% of the total funds to be arranged= Rs. (20% of 57600) crores
= Rs. 11520 crores
~= Rs. 11486 crores.

Rs. 11486 crores is the amount of funds to be arranged through External Assistance.


2. 

If NHAI could receive a total of Rs. 9695 crores as External Assistance, by what percent (approximately) should it increase the Market Borrowing to arrange for the shortage of funds?

A.4.5%
B.7.5%
C.6%
D.8%

Answer: Option C

Explanation:

Shortage of funds arranged 
through External Assistance
Therefore= Rs. (11486 - 9695) crores
= Rs. 1791 crores.

Therefore Increase required in Market Borrowing = Rs. 1791 crores.

Percentage increase required =(1791x 100)% = 5.98% ~= 6%.
29952


3. 

If the toll is to be collected through an outsourced agency by allowing a maximum 10% commission, how much amount should be permitted to be collected by the outsourced agency, so that the project is supported with Rs. 4910 crores?

यदि टोल को किसी आउटसोर्स एजेंसी के माध्यम से अधिकतम 10% कमीशन की अनुमति देकर एकत्र किया जाना है, तो आउटसोर्स एजेंसी द्वारा कितनी राशि एकत्र करने की अनुमति दी जानी चाहिए, ताकि परियोजना रुपये के साथ समर्थित हो। 4910 करोड़?

A.Rs. 6213 crores
B.Rs. 5827 crores
C.Rs. 5401 crores
D.Rs. 5316 crores

Answer: Option C

Explanation:

Amount permitted= (Funds required from Toll for projects of Phase II) +
   (10% of these funds)
= Rs. 4910 crores + Rs. (10% of 4910) crores
= Rs. (4910 + 491) crores
= Rs. 5401 crores.


4. 

The central angle corresponding to Market Borrowing is

A.52°
B.137.8°
C.187.2°
D.192.4°

Answer: Option C

Explanation:

Central angle corresponding to Market Borrowing =(29952x 360°(= 187.2°
57600


5. 

The approximate ratio of the funds to be arranged through Toll and that through Market Borrowing is

A.2 : 9
B.1 : 6
C.3 : 11
D.2 : 5

Answer: Option B

Explanation:

Required ratio =4910=1~=1.
299526.16


The following pie-charts show the distribution of students of graduate and post-graduate levels in seven different institutes in a town.

Distribution of students at graduate and post-graduate levels in seven institutes:

1. 

What is the total number of graduate and post-graduate level students is institute R?

A.8320
B.7916
C.9116
D.8099

Answer: Option D

Explanation:

Required number= (17% of 27300) + (14% of 24700)
= 4641 + 3458
= 8099.


2. 

What is the ratio between the number of students studying at post-graduate and graduate levels respectively from institute S?

A.14 : 19
B.19 : 21
C.17 : 21
D.19 : 14

Answer: Option D

Explanation:

Required ratio =(21% of 24700)=(21 x 24700)=19.
(14% of 27300)14 x 2730014


3. 

How many students of institutes of M and S are studying at graduate level?

A.7516
B.8463
C.9127
D.9404

Answer: Option B

Explanation:

Students of institute M at graduate level= 17% of 27300 = 4641.

Students of institute S at graduate level = 14% of 27300 = 3822.

Therefore Total number of students at graduate in institutes M and S= (4641 + 3822)
= 8463.


4. 

What is the ratio between the number of students studying at post-graduate level from institutes S and the number of students studying at graduate level from institute Q?

A.13 : 19
B.21 : 13
C.13 : 8
D.19 : 13

Answer: Option D

Explanation:

Required ratio =(21% of 24700)=(21 x 24700)=19.
(13% of 27300)13 x 2730013


5. 

Total number

3. 

If amongst other countries, Switzerland accounted for 25% of the Indian tourist traffic, and it is known from official Swiss records that a total of 25 lakh Indian tourists had gone to Switzerland during the year, then find the number of 30-39 year old Indian tourists who went abroad in that year ?

A.18.75 lakh
B.25 lakh
C.50 lakh
D.75 lakh

Answer: Option D

Explanation:

Tourist traffic from other countries to Swiz is 20%.

Amongst this 20%, 25% of traffic from India.

So, 25% of 20% = 5% corresponds to the Indian traffic in Switzerland.

5 % corresponds to Switzerland's 25 lakh. Hence 15% will be 75 lakh.

The following pie chart give the information about the distribution of weight in the human body according to different kinds of components. Study the pie charts and answer the question.

Distribution of Weight in Human Body

1. 

What percentage of proteins of the human body is equivalent to the weight of its skin ?

A.41.66 %
B.43.33 %
C.44.44 %
D.Cannot be determined

Answer: Option A

Explanation:

Total percentage = (10 / 24) x 100 = 41.6666667 %


2. 

How much of the human body is neither made of bones or skin ?

A.40 %
B.50 %
C.60 %
D.70 %

Answer: Option D

Explanation:

20 + 10 = 30% is made up of either bones or skin. Hence, 70% is made up of neither.


3. 

What is the ratio of the distribution of proteins in the muscles to that of the distribution of proteins in the bones ?

A.2:1
B.2:3
C.3:2
D.Cannot be determined

Answer: Option D

Explanation:

It cannot be determined since the respective distributions are not known.

The pie chart shows the distribution of New York market share by value of different computer companies in 2005.

The pie chart shows the distribution of New York market share by volume of different computer companies in 2005.

Number of units sold in 2005 in New York = 1,500

Value of units sold in 2005 in New York = US $1,650,000.

1. 

For the year 2005, which company has realised the lowest average unit sales price for a PC ?

A.Commodore
B.IBM
C.Tandy
D.Cannot be determined


2. 

Over the period 2005-2006, if sales (value-wise) of IBM PC's increased by 50% and of Apple by 15% assuming that PC sales of all other computer companies remained the same, by what percentage (approximately) would the PC sales in New York (value-wise) increase over the same period ?

A.16.1 %
B.18 %
C.14 %
D.None of these


3. 

In 2005, the average unit sale price of an IBM PC was approximately (in US$)

A.3180
B.2800
C.393
D.3080

The following pie-chart shows the sources of funds to be collected by the National Highways Authority of India (NHAI) for its Phase II projects. Study the pie-chart and answers the question that follow.

Sources of funds to be arranged by NHAI for Phase II projects (in crores Rs.)

1. 

Near about 20% of the funds are to be arranged through:

A.SPVS
B.External Assistance
C.Annuity
D.Market Borrowing

Answer: Option B

Explanation:

20% of the total funds to be arranged= Rs. (20% of 57600) crores
= Rs. 11520 crores
~= Rs. 11486 crores.

Rs. 11486 crores is the amount of funds to be arranged through External Assistance.


2. 

If NHAI could receive a total of Rs. 9695 crores as External Assistance, by what percent (approximately) should it increase the Market Borrowing to arrange for the shortage of funds?

A.4.5%
B.7.5%
C.6%
D.8%

Answer: Option C

Explanation:

Shortage of funds arranged 
through External Assistance
Therefore= Rs. (11486 - 9695) crores
= Rs. 1791 crores.

Therefore Increase required in Market Borrowing = Rs. 1791 crores.

Percentage increase required =(1791x 100)% = 5.98% ~= 6%.
29952


3. 

If the toll is to be collected through an outsourced agency by allowing a maximum 10% commission, how much amount should be permitted to be collected by the outsourced agency, so that the project is supported with Rs. 4910 crores?

A.Rs. 6213 crores
B.Rs. 5827 crores
C.Rs. 5401 crores
D.Rs. 5316 crores

Answer: Option C

Explanation:

Amount permitted= (Funds required from Toll for projects of Phase II) +
   (10% of these funds)
= Rs. 4910 crores + Rs. (10% of 4910) crores
= Rs. (4910 + 491) crores
= Rs. 5401 crores.


4. 

The central angle corresponding to Market Borrowing is

A.52°
B.137.8°
C.187.2°
D.192.4°

Answer: Option C

Explanation:

Central angle corresponding to Market Borrowing =(29952x 360°(= 187.2°
57600


5. 

The approximate ratio of the funds to be arranged through Toll and that through Market Borrowing is

A.2 : 9
B.1 : 6
C.3 : 11
D.2 : 5

Answer: Option B

Explanation:

Required ratio =4910=1~=1.
299526.16


The following pie-charts show the distribution of students of graduate and post-graduate levels in seven different institutes in a town.

Distribution of students at graduate and post-graduate levels in seven institutes:

1. 

What is the total number of graduate and post-graduate level students is institute R?

A.8320
B.7916
C.9116
D.8099

Answer: Option D

Explanation:

Required number= (17% of 27300) + (14% of 24700)
= 4641 + 3458
= 8099.

2. 

What is the ratio between the number of students studying at post-graduate and graduate levels respectively from institute S?

A.14 : 19
B.19 : 21
C.17 : 21
D.19 : 14

Answer: Option D

Explanation:

Required ratio =(21% of 24700)=(21 x 24700)=19.
(14% of 27300)14 x 2730014


3. 

How many students of institutes of M and S are studying at graduate level?

A.7516
B.8463
C.9127
D.9404

Answer: Option B

Explanation:

Students of institute M at graduate level= 17% of 27300 = 4641.

Students of institute S at graduate level = 14% of 27300 = 3822.

Therefore Total number of students at graduate in institutes M and S= (4641 + 3822)
= 8463.


4. 

What is the ratio between the number of students studying at post-graduate level from institutes S and the number of students studying at graduate level from institute Q?

A.13 : 19
B.21 : 13
C.13 : 8
D.19 : 13

Answer: Option D

Explanation:

Required ratio =(21% of 24700)=(21 x 24700)=19.
(13% of 27300)13 x 2730013

Study the following pie-chart and the table and answer the questions based on them.

Proportion of Population of Seven Villages in 1997

Village% Population Below Poverty Line
X38
Y52
Z42
R51
S49
T46
V58
1. 

If the population of village R in 1997 is 32000, then what will be the population of village Y below poverty line in that year?

A.14100
B.15600
C.16500
D.17000

Answer: Option B

Explanation:

Population of village R = 32000 (given).

Let the population of village Y be y.

Then, 16 : 15 = 32000 : y     => y =(15 x 32000)= 30000.
16

Therefore Population of village Y below poverty line = 52% of 30000 = 15600.


2. 

The ratio of population of village T below poverty line to that of village Z below poverty line in 1997 is:

A.11 : 23
B.13 : 11
C.23 : 11
D.11 : 13

Answer: Option C

Explanation:

Let N be the total population of all the seven villages.

Then, population of village T below poverty line = 46% of (21% of N)

and Population of villages Z below the poverty line = 42% of (11% of N)

Therefore Required ratio =46% of (21% of N)=46 x 21= 23/11.
42% of (11 % of N)42 x 11


3. 

Find the population of village S if the population of village X below poverty line in 1997 is 12160.

A.18500
B.20500
C.22000
D.26000

Answer: Option C

Explanation:

Let the population of village X be x.

Then, 38% of x = 12160   =>   x =12160 x 100= 32000.
38

Now, if s be the population of village S, then

16 : 11 = 32000 : s     =>     s =(11 x 3200)= 22000.
16


4. 

If in 1998, the population of villages Y and V increase by 10% each and the percentage of population below poverty line remains unchanged for all the villages, then find the population of village V below poverty line in 1998, given that the population of village Y in 1997 was 30000.

A.11250
B.12760
C.13140
D.13780

Answer: Option B

Explanation:

Population of village Y in 1997 = 30000 (given).

Let the population of village V in 1997 be v.

Then, 15 : 10 = 30000 : v     =>     v =30000 x 10= 20000.
15

Now, population of village V in 1998 = 20000 + (10% of 20000) = 22000.

Therefore Population of village V below poverty line in 1998 = 58% of 22000 = 12760.


The following pie chart shows the amount of subscriptions generated for India Bonds from different categories of investors.

Subscriptions Generated for India Bonds

1. 

In the corporate sector, approximately how many degrees should be there in the central angle ?

A.120
B.121
C.122
D.123

Answer: Option C

Explanation:

34 x 3.6 = 122.4 (since 1% = 3.6 degrees)


2. 

If the investment by NRI's are Rs 4,000 crore, then the investments by corporate houses and FII's together is:

A.24,000 crore
B.24,363 crore
C.25,423 crore
D.25,643 crore

Answer: Option B

Explanation:

(67/11) x 4000 = 24 363.6364


3. 

What percentage of the total investment is coming from FII's and NRI's ?

A.33 %
B.11 %
C.44 %
D.22 %

Answer: Option C

Explanation:

(33 + 11) = 44


4. 

If the total investment other than by FII and corporate houses is Rs 335,000 crore, then the investment by NRI's and Offshore funds will be (approximately) ?

A.274,100
B.285,600
C.293,000
D.Cannot be determined

Answer: Option A

Explanation:

Investment other than NRI and corporate houses is 33% = 335000. Also, investment by offshore funds and NRI's is equal to 27%.

Hence, 27 x 335,000/33 = 274 090.909


5. 

If the total investment flows from FII's were to be doubled in the next year and the investment flows from all other sources had remained constant at their existing levels for this year, then what would be the proportion of FII investment in the total investment into India Bonds next year (in US $ millions) ?

A.40 %
B.50 %
C.60 %
D.70 %

Answer: Option B

Explanation:

FII's currently account for 33 out of 100.

If their value is doubled and all other investments are kept constant then their new value would be 66 out of 133 = approximately equal to 50%

The circle-graph given here shows the spendings of a country on various sports during a particular year. Study the graph carefully and answer the questions given below it.

1. 

What percent of total spending is spent on Tennis?

A.
121%
2
B.
221%
2
C.25%
D.45%

Answer: Option A

Explanation:

Percentage of money spend on Tennis =(45x 100)% = 121%.
3602


2. 

How much percent more is spent on Hockey than that on Golf?

A.27%
B.35%
C.37.5%
D.75%

Answer: Option D

Explanation:

Let the total spendings on sports be Rs. x. Then,

Amount spent on Golf = Rs.(36x)= Rs.x.
36010
Amount spent on Hockey = Rs(63x)= Rs.7x.
36040
Difference = Rs.(7x-x)= Rs3x.
401040
Therefore Required percentage = Rs.((3x/40)x 100)% = 75%.
x/10


3. 

If the total amount spent on sports during the year be Rs. 1,80,00,000 , the amount spent on Basketball exceeds on Tennis by:

A.Rs. 2,50,000
B.Rs. 3,60,000
C.Rs. 3,75,000
D.Rs. 4,10,000

Answer: Option A

Explanation:

Amount spent on Basketball exceeds that on Tennis by:

Rs.((50 - 45)x 1,80,00,000)= Rs. 2,50,000.
360


4. 

How much percent less is spent on Football than that on Cricket?

A.
222%
9
B.27%
C.
331%
3
D.
371%
7

Answer: Option C

Explanation:

Let the total spendings on sports be Rs. x. Then,

Amount spent on Cricket = Rs.(81x)= Rs.9x.
36040
Amount spent on Football = Rs(54x)= Rs.3x.
36020
Difference = Rs.(9x-3x)= Rs3x.
402040
Therefore Required percentage = Rs.((3x/40)x 100)% = 331%.
9x/403


5. 

If the total amount spent on sports during the year was Rs. 2 crores, the amount spent on Cricket and Hockey together was:

A.Rs. 8,00,000
B.Rs. 80,00,000
C.Rs. 1,20,00,000
D.Rs. 1,60,00,000

Answer: Option B

Explanation:

Amount spent on Cricket and Hockey together
= Rs.((81 + 63)x 2)crores
360
= Rs. 0.8 crores
= Rs. 80,00,000.


Study the following graph carefully and answer the questions given below:

Distribution of candidates who were enrolled for MBA entrance exam and the candidates (out of those enrolled) who passed the exam in different institutes:

1. 

What percentage of candidates passed the Exam from institute T out of the total number of candidates enrolled from the same institute?

A.50%
B.62.5%
C.75%
D.80%

Answer: Option C

Explanation:

Required percentage =(9% of 5700x 100)% =(9 x 5700x 100)% = 75%.
8% of 85508% of 8550


2. 

Which institute has the highest percentage of candidates passed to the candidates enrolled?

A.Q
B.R
C.V
D.T

Answer: Option B

Explanation:

The percentage of candidates passed to candidates enrolled can be determined for each institute as under:

(i) P =[(18% of 5700)x 100]% =[18 x 5700x 100]% = 54.55%.
22% of 855022 x 8550
(ii) Q =[(17% of 5700)x 100]%= 75.56%.
15% of 8550
(iii) R =[(13% of 5700)x 100]%= 86.67%.
10% of 8550
(iv) S =[(16% of 5700)x 100]%= 62.75%.
17% of 8550
(v) T =[(9% of 5700)x 100]%= 75%.
8% of 8550
(vi) V =[(15% of 5700)x 100]%= 83.33%.
12% of 8550
(vii) X =[(12% of 5700)x 100]%= 50%.
16% of 8550

Highest of these is 86.67% corresponding to institute R.


3. 

The number of candidates passed from institutes S and P together exceeds the number of candidates enrolled from institutes T and R together by:

A.228
B.279
C.399
D.407

Answer: Option C

Explanation:

Required difference= [(16% + 18%) of 5700] - [(8% + 10%) of 8550]
= [(34% of 5700) - (18% of 8550)]
= (1938 - 1539)
= 399.


4. 

What is the percentage of candidates passed to the candidates enrolled for institutes Q and R together?

A.68%
B.80%
C.74%
D.65%

Answer: Option B

Explanation:

Candidates passed from institutes Q and R together= [(13% + 17%) of 5700]
= 30% of 5700.
Candidates enrolled from institutes Q and R together= [(15% + 10%) of 8550]
= 25% of 8550.
Therefore Required Percentage
=(30% of 5700x 100)%
25% of 8550
=(30 x 5700x 100)%
25 x 8550
= 80%.


5. 

What is the ratio of candidates passed to the candidates enrolled from institute P?

A.9 : 11
B.14 : 17
C.6 : 11
D.9 : 17

Answer: Option C

Explanation:

Required ratio =(18% of 5700)=(18 x 5700)=6.
22% of 855022 x 855011


Study the following pie-diagrams carefully and answer the questions given below it:

Percentage Composition of Human Body

1. 

What percent of the total weight of human body is equivalent to the weight of the proteins in skin in human body?

A.0.016
B.1.6
C.0.16
D.Data inadequate

Answer: Option B

Explanation:

Let the body weight be x kg.

Then, weight of skin protein in the body
=[16% of(1of x)]kg
10
=(16x)kg.
1000
Therefore Required percentage =[
(16x)
1000
x 100]% = 1.6%.
x


2. 

What will be the quantity of water in the body of a person weighing 50 kg?

A.20 kg
B.35 kg
C.41 kg
D.42.5 kg

Answer: Option B

Explanation:

Quantity of water in the body of a person weighing 50 kg= (70% of 50) kg
= 35 kg.


3. 

What is the ratio of the distribution of proteins in the muscles to that of the distribution of proteins in the bones?

A.1 : 18
B.1 : 2
C.2 : 1
D.18 : 1

Answer: Option C

Explanation:

Required ratio =
 16% of1 
3
=6=2.
 16% of1 
6
31


4. 

To show the distribution of proteins and other dry elements in the human body, the arc of the circle should subtend at the centre an angle of:

A.54°
B.126°
C.108°
D.252°

Answer: Option C

Explanation:

Percentage of proteins and other dry elements in the body= (16% + 14%)
= 30%.
Therefore Central angle corresponding to proteins and other dry elements together
= 30% of 360°
= 108°.


5. 

In the human body, what part is made of neither bones nor skin?

A.
1
40
B.
3
80
C.
2
5
D.None of these

Answer: Option D

Explanation:

Part of the body made of neither bones nor skin = 1 - (1+1)=11.
61015


 of students studying at post-graduate level from institutes N and P is

A.5601
B.5944
C.6669
D.8372

Answer: Option C

Explanation:

Required number= (15% of 24700) + (12% of 24700)
= 3705 + 2964
= 6669.